

The Guest Nights Model is a platform that seamlessly integrates data from accommodation providers and business registries, facilitating a holistic evaluation of tourism dynamics and their economic contributions. By integrating information from these diverse sources, the system delivers granular insights at the municipal and regional level, along with key performance indicators such as:
- Guest nights
- Tourist arrivals
- Average length of stay
- Annual and monthly growth rates
- Distribution of tourism-related businesses
This unified framework enables robust comparative analyses across municipalities/regions and longitudinal trend assessments over multiple years. As a result, it empowers stakeholders with data-driven insights to inform strategic decision-making and foster sustainable growth in the tourism sector.
Strategic Benefits
This tool empowers stakeholders to measure, compare, and forecast tourism and economic activity with precision, fostering sustainable regional/municipal development.
Data-Driven Decision-Making
Supports policymakers, tourism boards, and businesses in identifying trends, benchmarking performance, and optimizing strategies.
Dynamic Visualization
Intuitive maps and charts enhance data interpretation.
Customizable Reporting
Exportable tables allow for further analysis and integration with external reports.
Tourism & Business Data Fusion
By combining accommodation statistics with business registry data, the tool delivers enhanced analytical insights into tourism performance.
Key Features & Analytical Capabilities
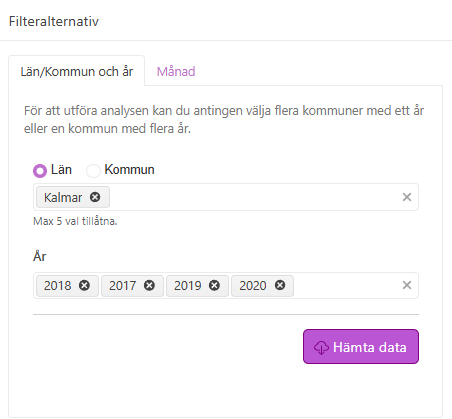
Flexible Data Selection
- Single Region/Municipality + Multiple Years: Enables longitudinal trend analysis.
- Multiple Regions/Municipalities + Single Year: Facilitates cross-regional benchmarking.
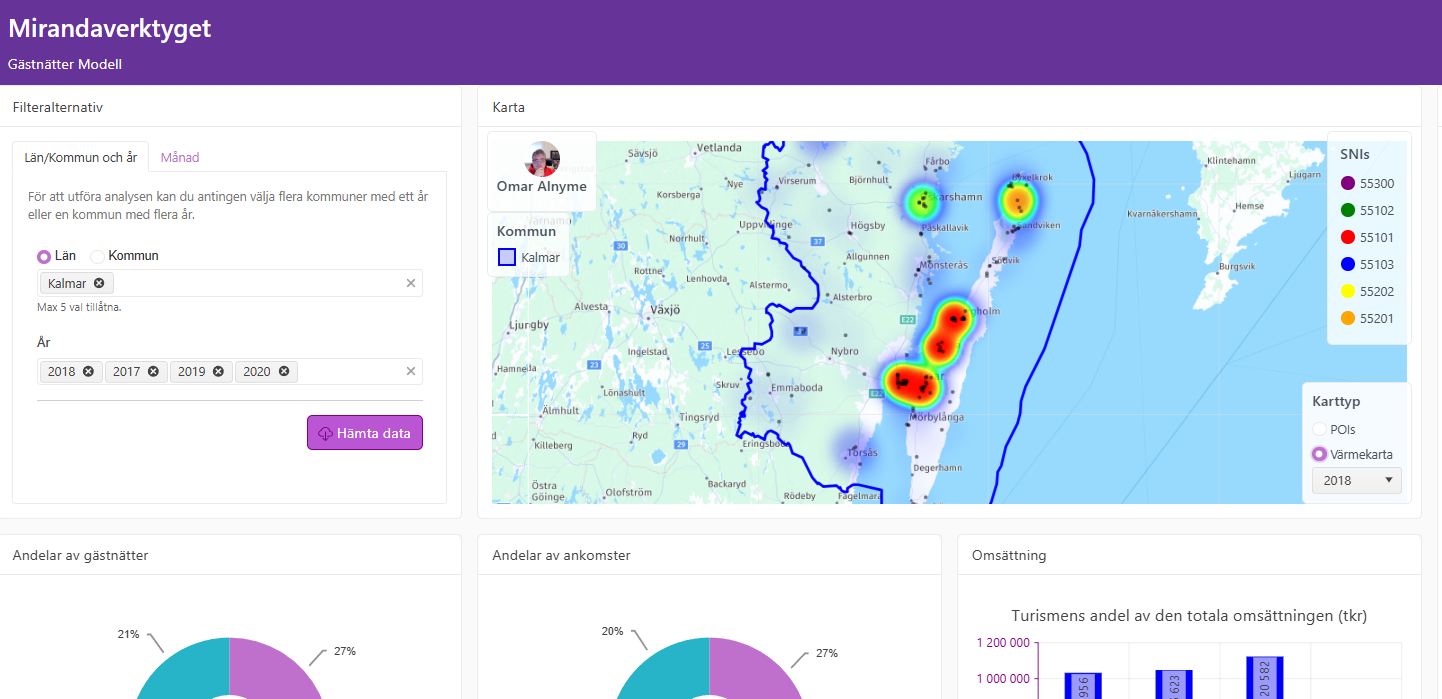
Interactive Map Visualization
- Displays all workplaces within the selected area, categorized by SNI (industry classification) codes.
- Clickable POIs (Points of Interest) provide detailed workplace insights, including:
- Parent company information
- Number of associated workplaces
- Heatmap overlay where intensity reflects turnover values.
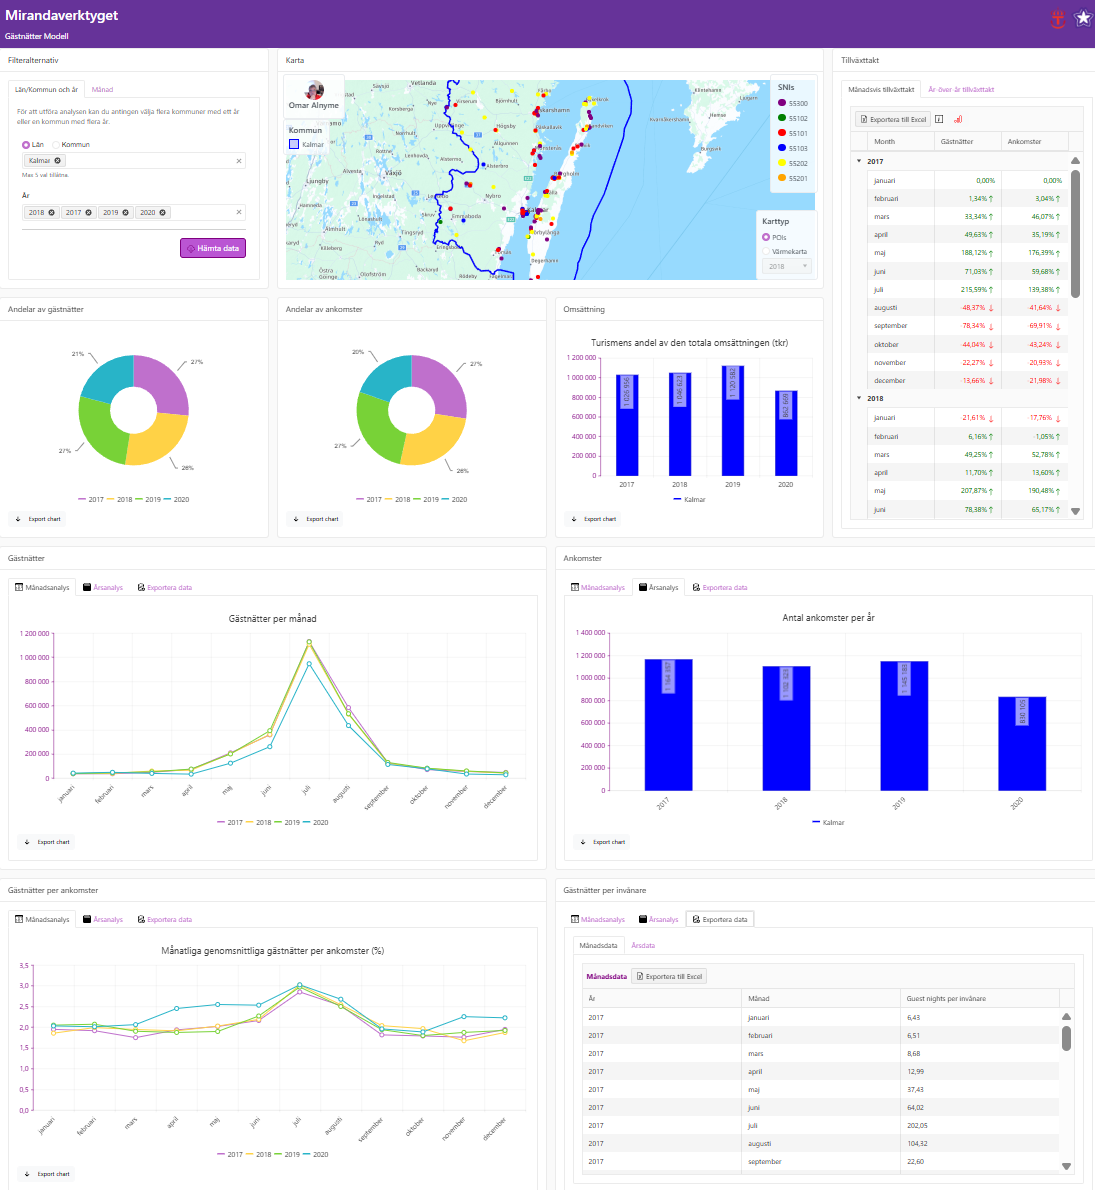
Reporting Modules
- Guest Nights Analysis
- Charts:
- Pie Chart – Distribution of booked nights per year.
- Line chart – Total booked night per month.
- Bar Chart – Total booked nights by year.
- Exportable Data Tables: Monthly & yearly guest night figures.
- Charts:
- Arrivals Analysis
- Charts:
- Pie Chart – Share of total arrivals per year.
- Line chart – Total arrivals per month.
- Bar Chart – Total arrivals by year.
- Exportable Data Tables: Monthly & yearly arrival statistics.
- Charts:
- Guest Nights per Arrival
- Charts:
- Line Chart – Monthly average guest nights per arrival.
- Bar Chart – Yearly average guest nights per arrival.
- Exportable Data Tables: Monthly & yearly breakdowns.
- Charts:
- Guest Nights per Inhabitant
- Charts:
- Line Chart – Monthly average guest nights per inhabitant.
- Bar Chart – Yearly average guest nights per inhabitant.
- Exportable Data Tables: Monthly & yearly figures.
- Charts:
- Growth Rate Analysis
- Charts:
- Line Chart – Monthly and yearly growth rate trends across selected years/municipalities.
- Exportable Tables:
- Monthly growth rates by selected years/municipalities.
- Yearly growth rates by selected years.
- Charts:
- Turnover
- Charts:
- Bar chart – display total turnover by year/municipality.
- Maps:
- SNI-coded workplace locations.
- Interactive heatmaps (intensity based on turnover value).
- Charts:
Last Updated: