

This model is designed to integrate and harmonize heterogeneous datasets, enabling a comprehensive, data-driven assessment of tourism trends, private sector activity, and urban mobility patterns. By systematically combining lodging statistics (including traditional accommodations and private-sector platforms such as Airbnb), granular revenue data at the microeconomic level, and high-resolution traffic flow metrics derived from security camera networks, the model facilitates a multidimensional spatial-temporal analysis of municipal/regional dynamics.
Built on a scalable analytical framework, this tool transforms raw data into actionable intelligence, bridging the gap between academic rigor and real-world applicability. Its outputs empower researchers, policymakers, and industry leaders to decode complex regional ecosystems with precision.
Key Analytical Strengths
Cross-Domain Data Fusion
The model employs advanced data integration techniques to integrate different data sources, ensuring consistency and enabling holistic insights into the interplay between economic activity, visitor mobility, and infrastructure utilization.
Spatial-Temporal Pattern Recognition
Leveraging geospatial analytics and time-series decomposition, the tool identifies trends, seasonal variations, and anomalies in tourism demand, private sector performance, and traffic congestion.
Network Effects & Interdependencies
By applying econometric and graph-based methods, the framework quantifies the reciprocal relationships between variables, such as how short-term rental growth impacts local business revenues or how traffic fluctuations correlate with tourist inflows.
Key Features
Regional and Temporal Analysis
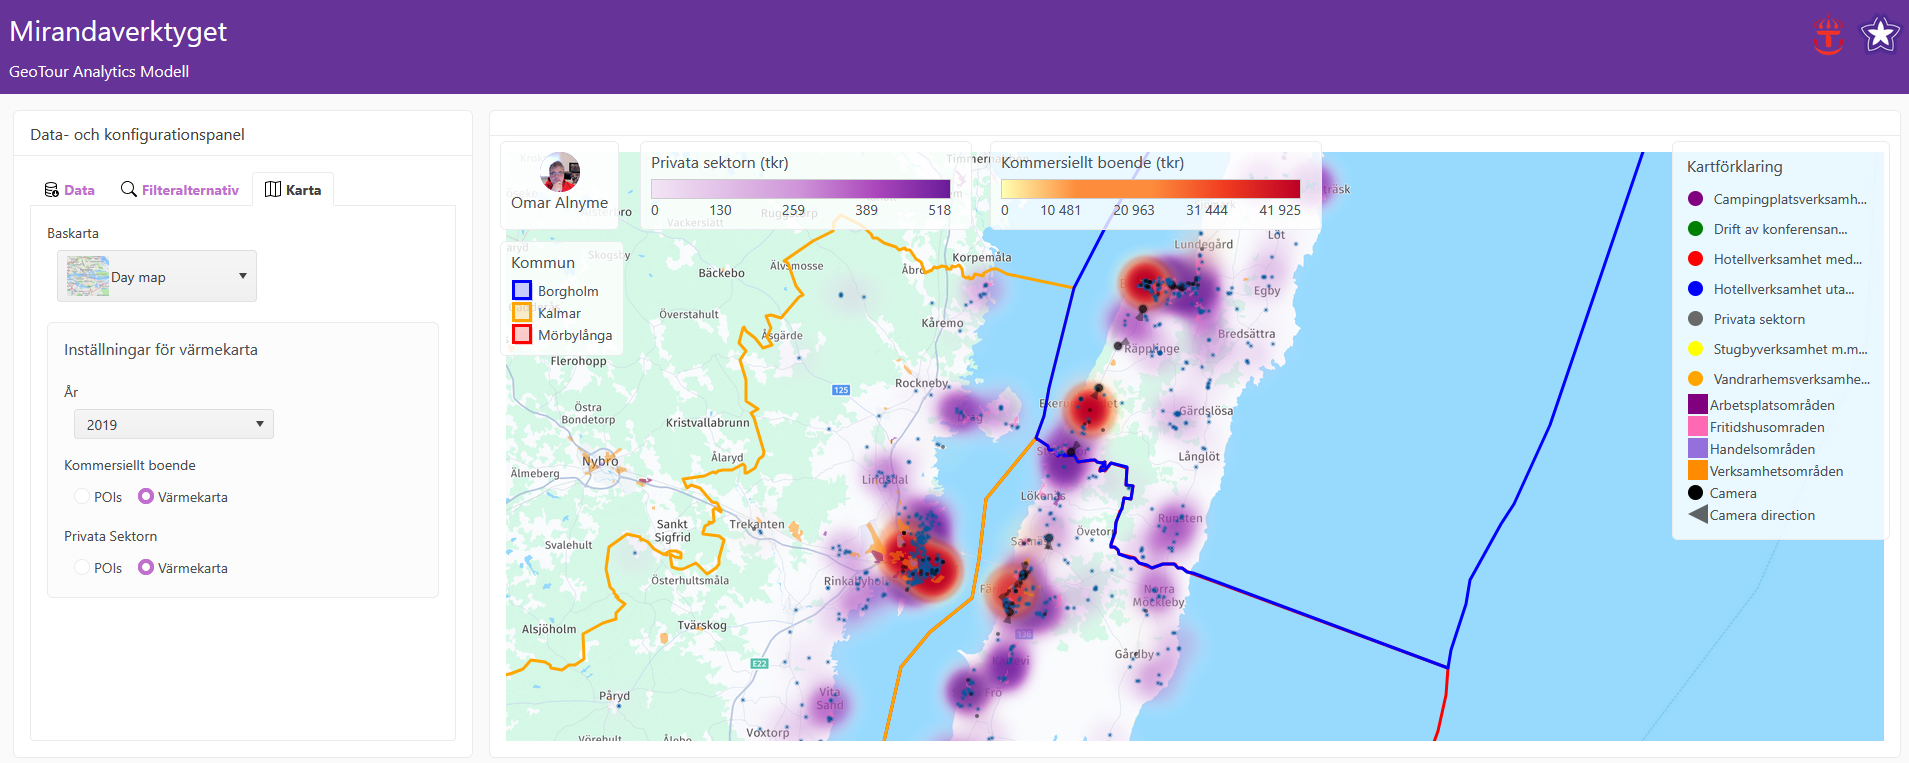
- Select specific regions/municipalities and time periods to generate tailored reports.
- Visualize commercial and private sector data on an interactive map, with customizable heatmaps to highlight activity hotspots.
Traffic Flow Intelligence
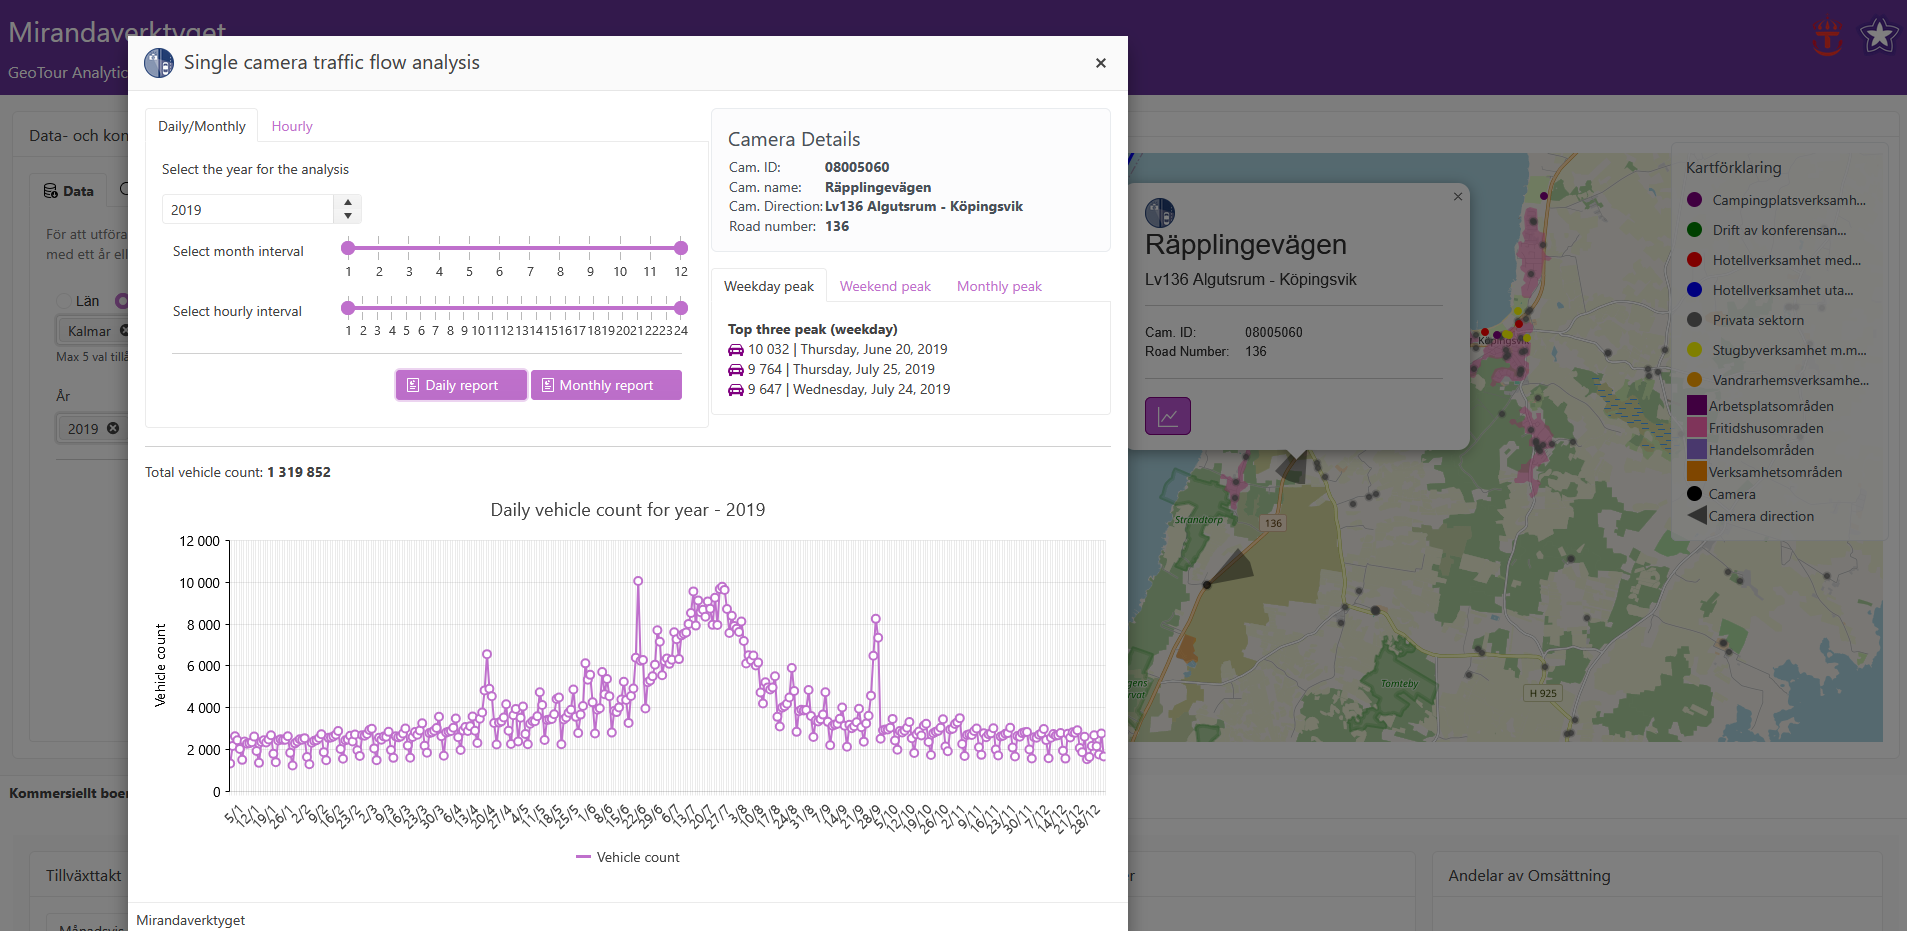
- Access historical traffic data from safety cameras within selected areas.
- Analyze hourly, daily, monthly, or yearly traffic trends, including weekday, weekend, and peak monthly patterns.
Sector-Specific Insights
- Commercial Sector:
- Click on any Point of Interest (POI) to retrieve detailed workplace information, including parent company data, affiliated workplaces, and registered SNI codes.
- Private Sector:
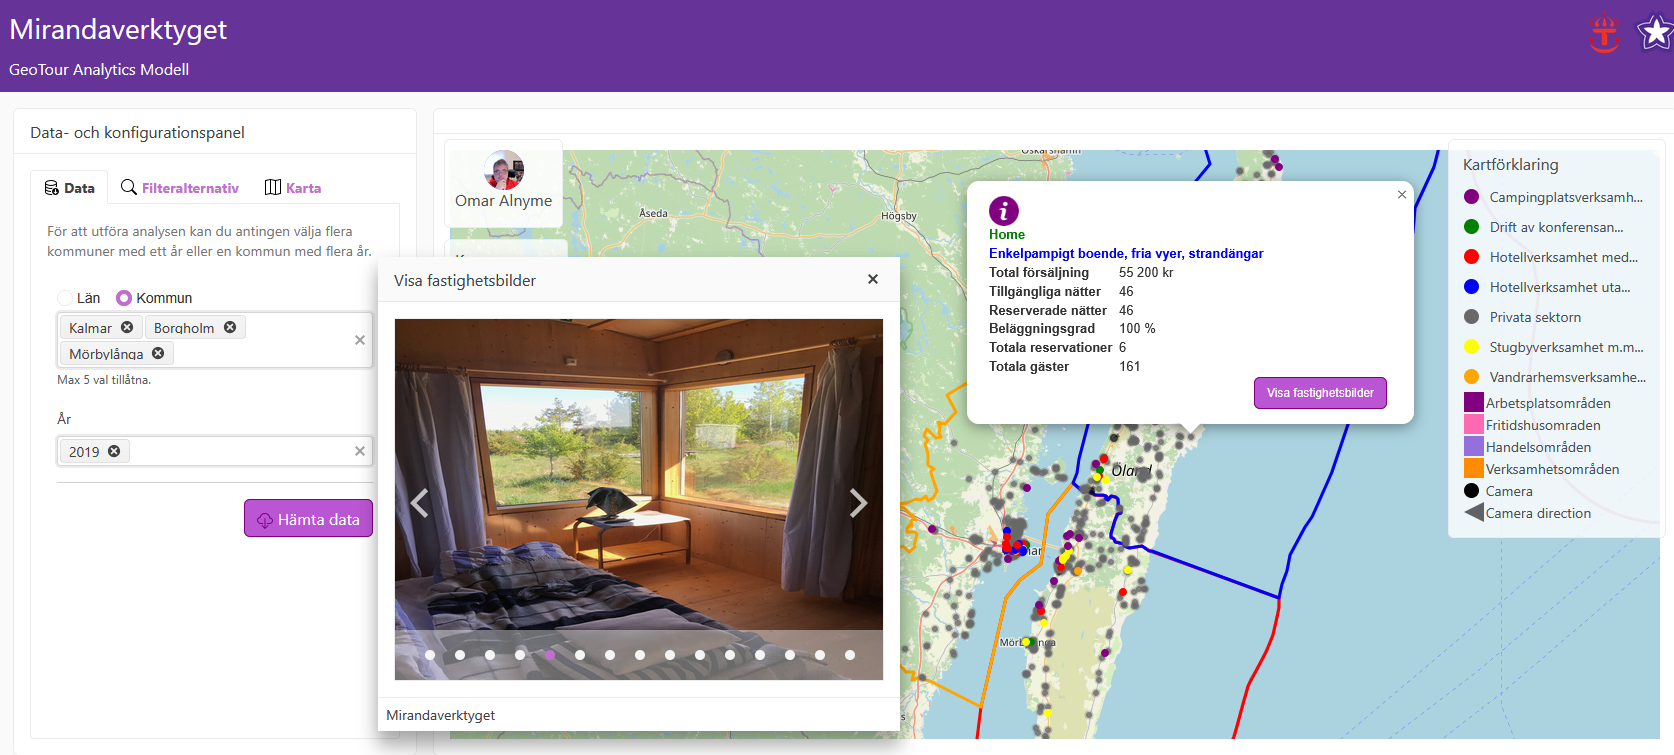
- View property-specific analytics such as total sales, booked nights, guest numbers, reservations, and occupancy rates.
- Explore property photos for enhanced context.
Dynamic Reporting
Generate comprehensive reports for selected regions and timeframes, including:
- Commercial Sector:
- Donut Charts: Compare turnover shares across municipalities or years.
- Bar Charts: Visualize total turnover and tourism contribution per municipality or year.
- Interactive Maps: Explore POI details and heatmaps weighted by tourism share of turnover.
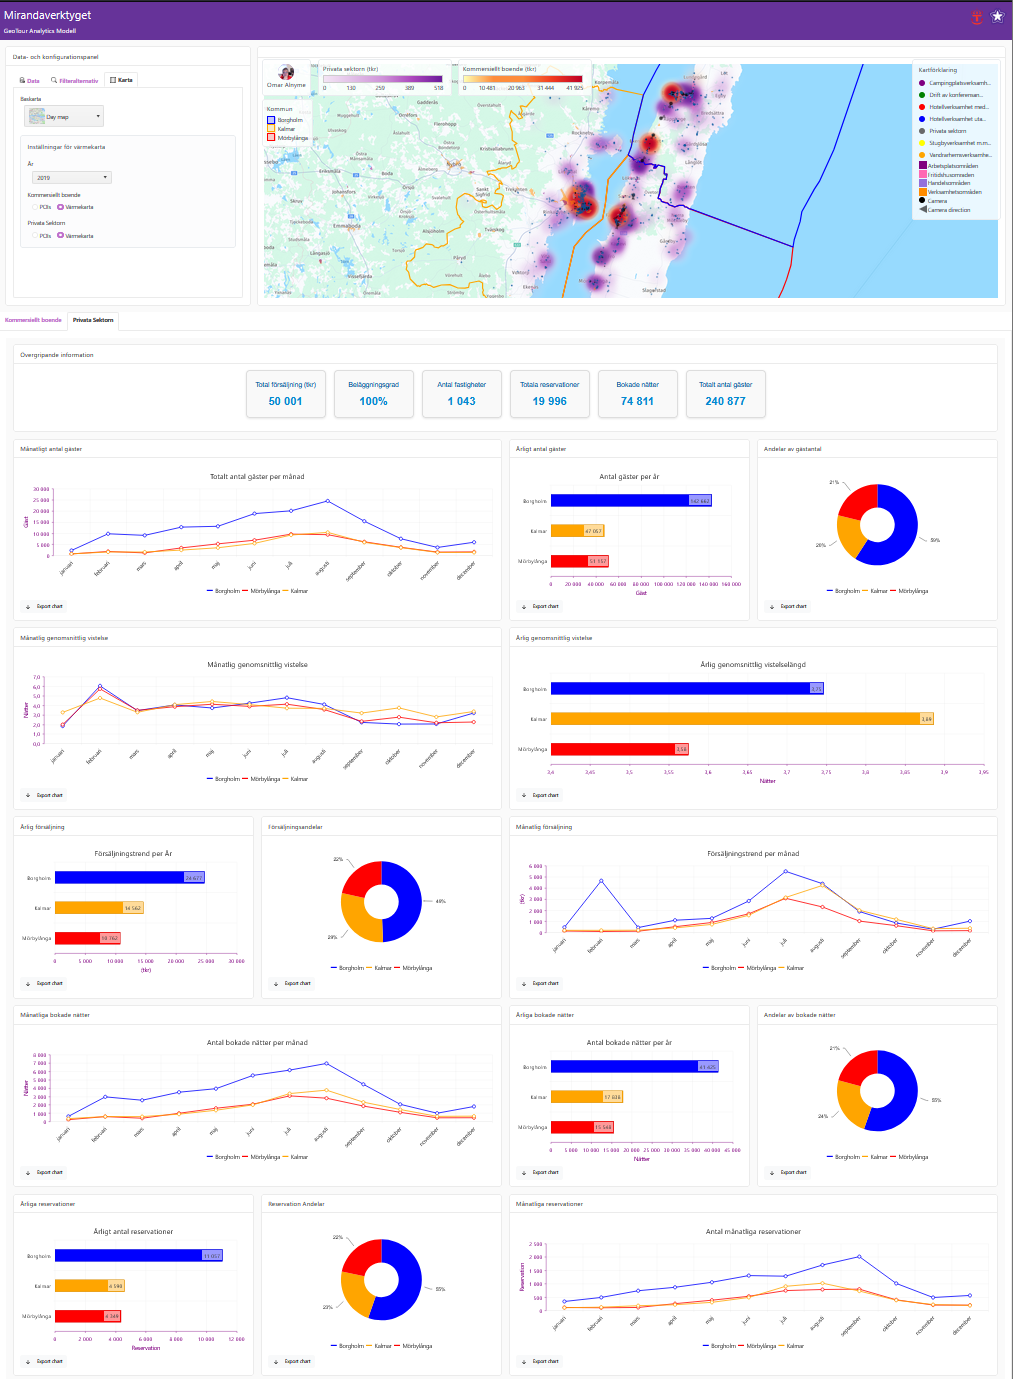
- Private Sector:
- Performance Metrics: Total sales, occupancy rates, property counts, reservations, booked nights, and guest statistics.
- Interactive Maps: Explore POI details and heatmaps weighted by total sales.
- Trend Analysis:
- Monthly and annual guest volumes, stay durations, and booking trends.
- Sales and reservation distributions across regions or years.
- Comparative shares of guests, nights booked, and revenue.
- Guest Nights (Commercial Sector):
- Please referee to the Gastnatter Model.
Last Updated: