

This model empowers users to conduct reachable range analysis by leveraging various transit modes including walking, driving, cycling, and bus across customizable time frames. Users can further enhance accuracy by incorporating either real-time or historical traffic data.
Once the isochrone (ISO) polygon is generated, the tool enables the extraction of all Points of Interests (POIs) within the defined area, facilitating detailed distance analyses from the ISO origin. These POIs can be systematically categorized by industry for targeted insights. Additionally, the model provides detailed demographic estimations, segmenting the population within the ISO boundary into five-year age groups (e.g. 0–4, 5–9, 10–14, etc.) for granular analysis.
To support transit planning, users can also evaluate available public transport options and their respective destinations originating from within the ISO polygon. This robust functionality makes it an invaluable solution for urban planning, logistics, market analysis, and transportation optimization.
Key features
- Supports walking, driving, cycling, and bus
- Customizable time intervals (e.g. 5/10/30 mins)
- Optional real-time or historical traffic data integration
- Auto-detect all POIs within the isochrone boundary
- Filter by industry (hotels, restaurants, etc.)
- Measure exact distances from origin
- Population estimates within the reachable area
- Age-group segmentation (0-4, 5-9, 10-14, etc.)
- Evaluate public transport routes from the ISO polygon
- Identify service gaps and optimize coverage
- Urban planning
- Market analysis
- Logistics
- Transport optimization
Core Analytical Capabilities
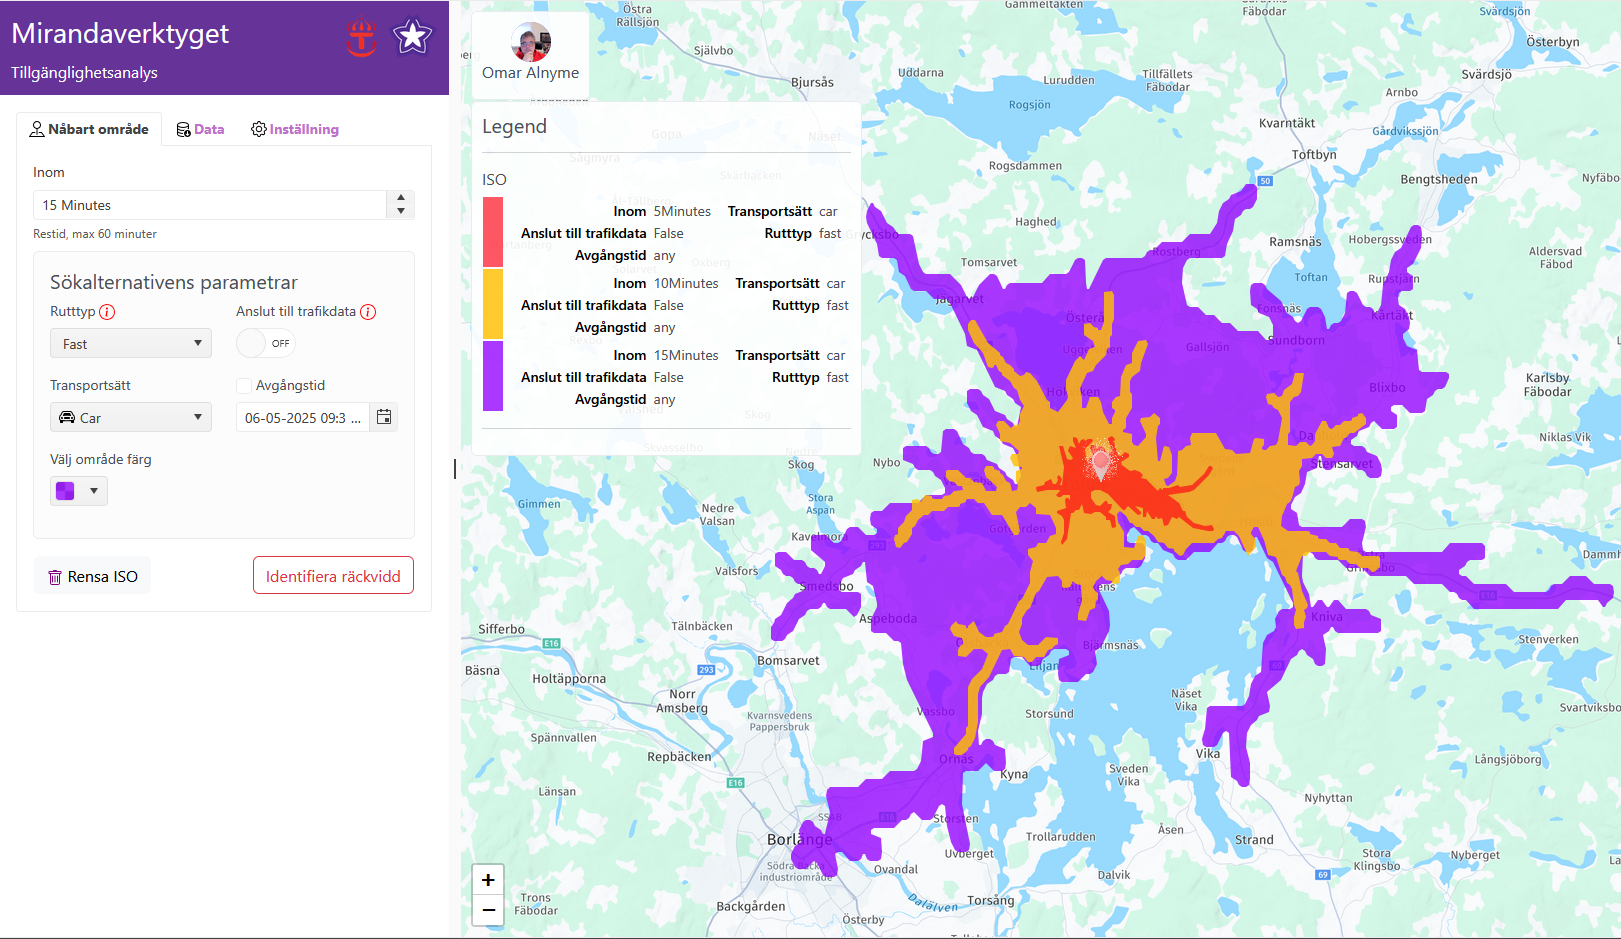
Dynamic Reachable Range Analysis
- Generate ISOs (time-based polygons) to visualize accessible areas from a given origin.
- Incorporate real-time or historical traffic data to enhance temporal accuracy, accounting for congestion patterns and variable speeds.
- Support for multi-modal transit scenarios (walking, cycling, driving, and public transit).
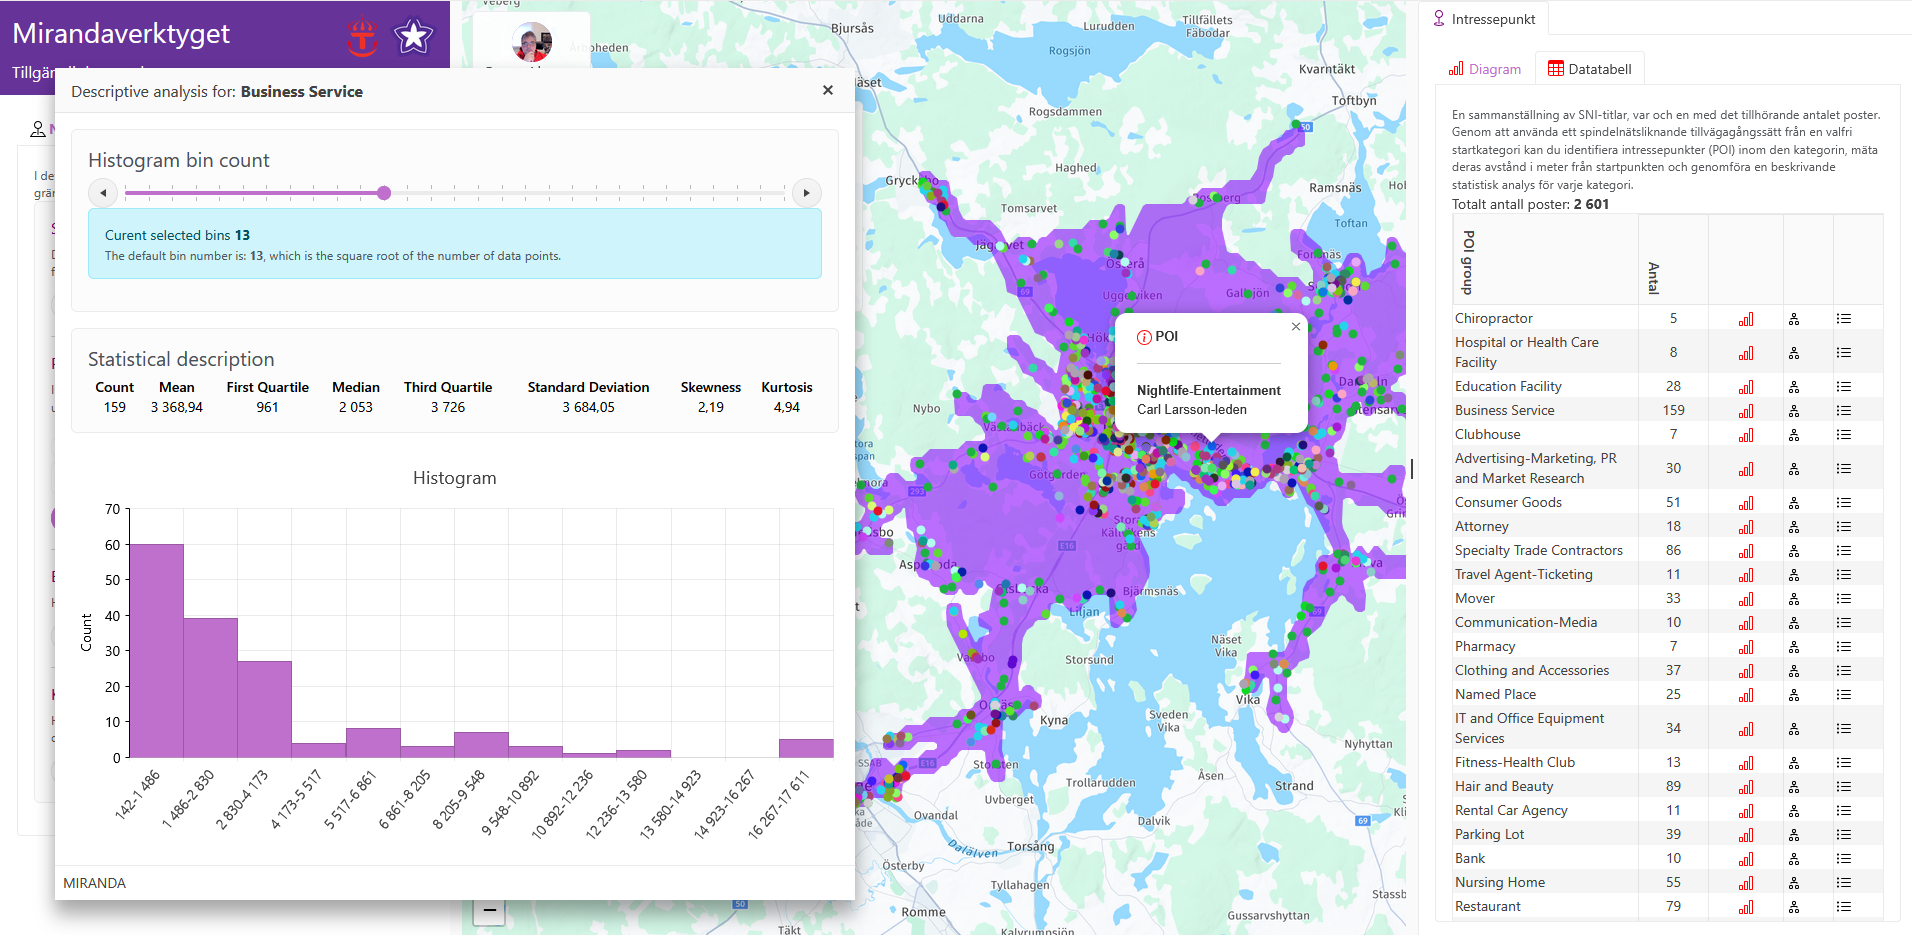
Points of Interest (POI) Identification and Statistical Insights
- Automatically detect and classify POIs (hotels, restaurants, etc.) within reachable boundaries.
- Compute descriptive statistics (density, average distance, industry distribution) to support competitive analysis.
- POI Classification by Industry
- Generates polylines on the map, originating from the selected starting point and extending to each point of interest (POI) associated with the selected industry, enabling a clear visual linkage between them.
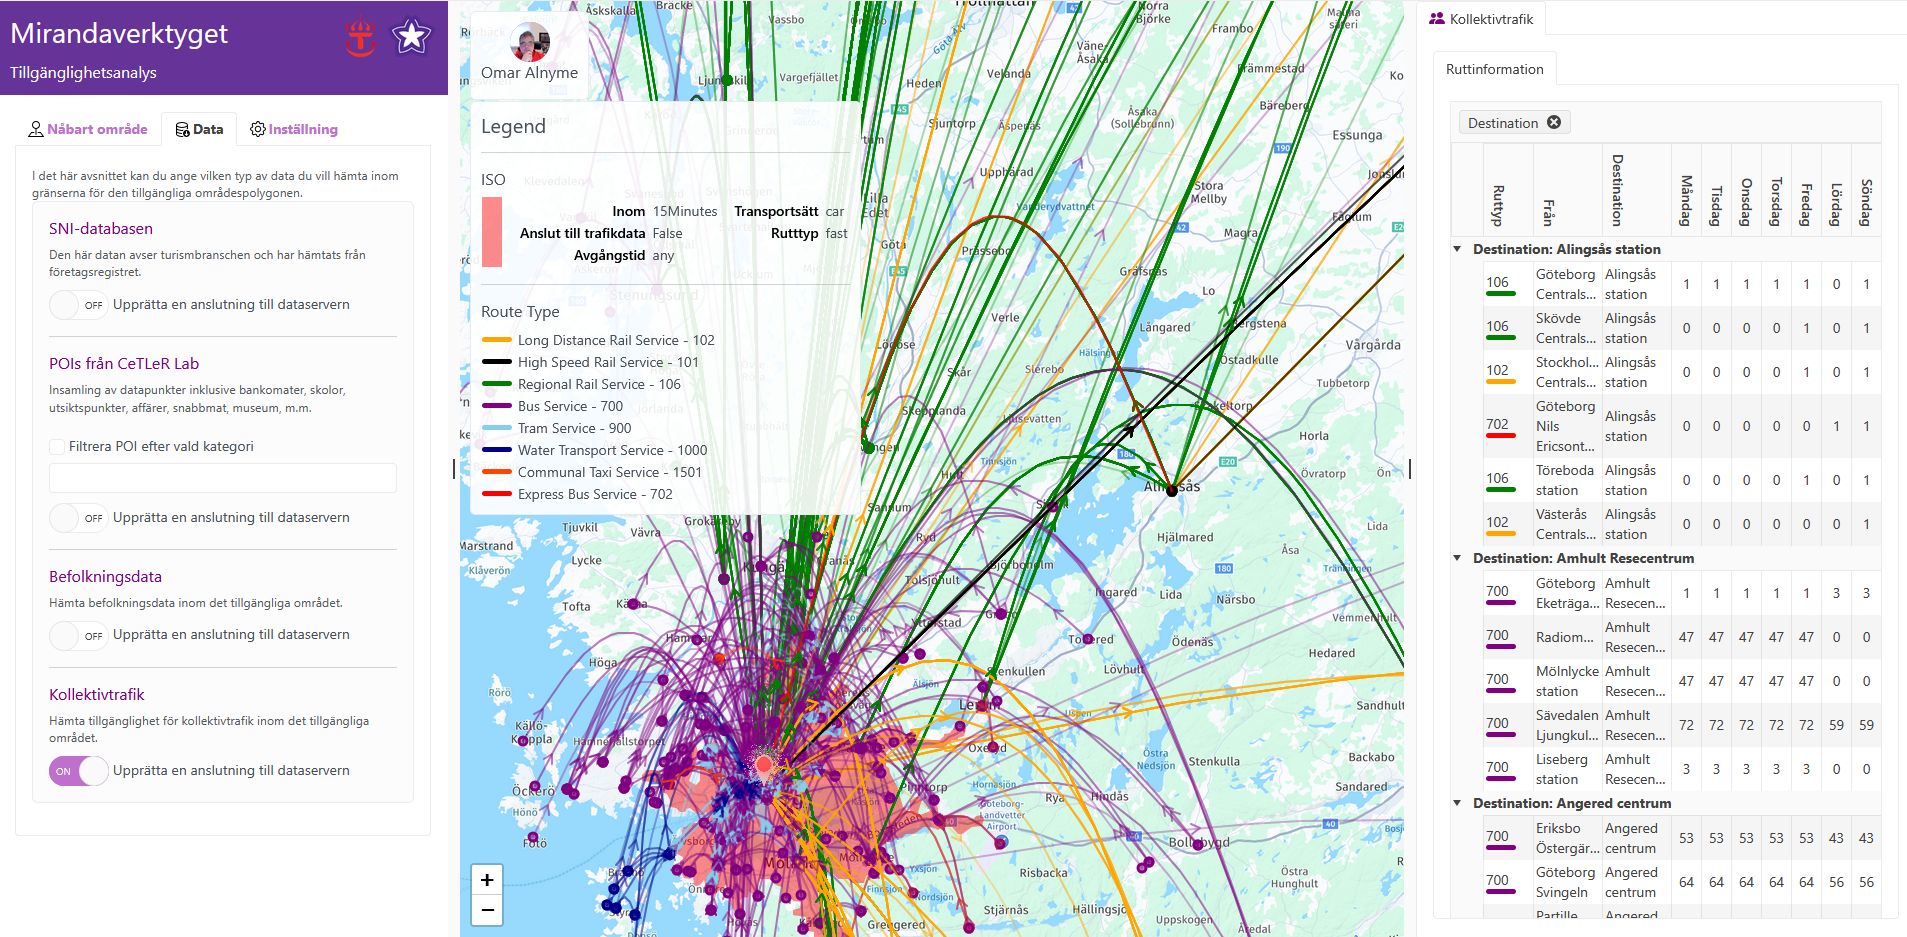
Public Transport Accessibility
Enhance your mobility studies with public transport network analytics, enabling data-driven decisions for urban planning, logistics, and service deployment.
- Identify transit stops, routes, and service frequencies within any reachable range.
- Filter by transport type (bus, tram, subway, rail, ferry, etc..) to assess mode-specific coverage gaps.
- Visualize temporal availability (peak vs. off-peak schedules) for dynamic operational insights.
- Automatically plot optimized polyline paths from origin to destinations, overlayed on the map for intuitive interpretation
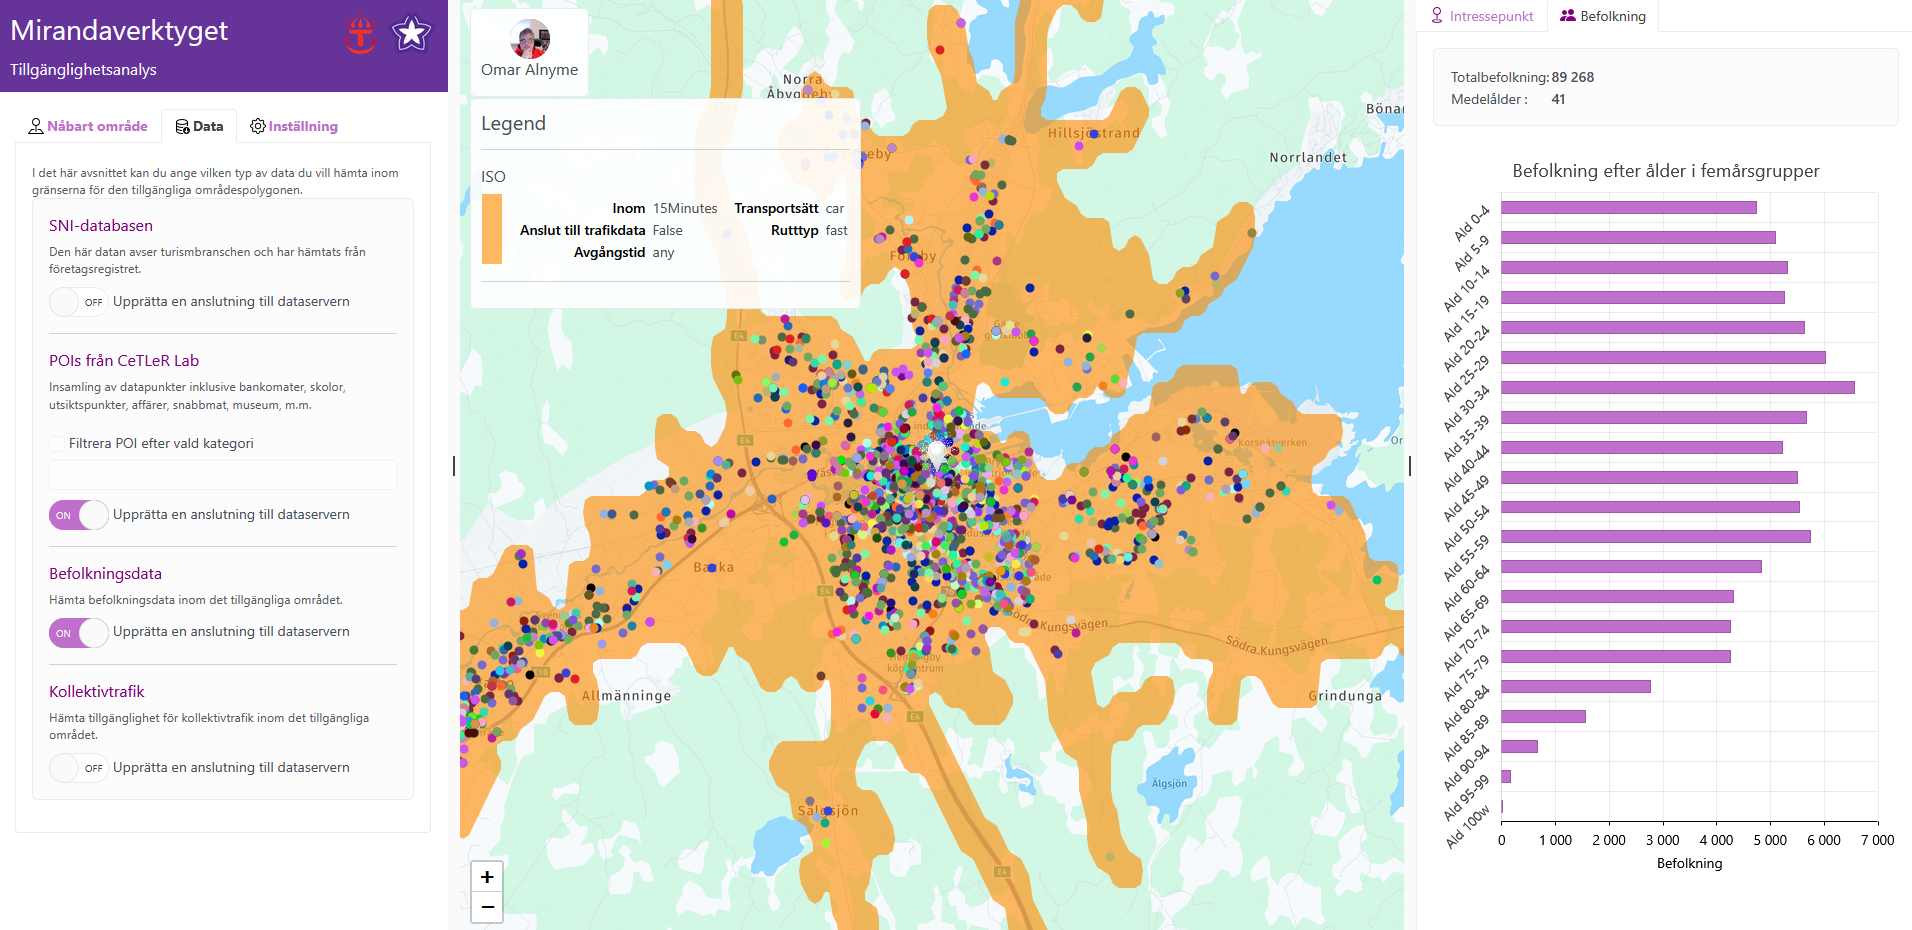
Demographic and Population Estimation
Integrate population datasets to quantify the resident or workforce population within reachable zones.
Last Updated: