

This model enables efficient and high-precision analysis of traffic flow data collected from the nation’s traffic safety cameras (speed cameras), which capture vehicular passages with ~95% accuracy. The system supports both individual camera analysis (e.g. localized traffic patterns) and aggregated multi-camera insights (e.g. corridor-wide trends), as well as route-level analysis (distance, duration, and CO₂ emissions between points, with optional waypoints).
Key Capabilities:
Granular & Network-Wide Analysis
- Single-camera: Hourly/daily/monthly traffic volume at specific locations.
- Multi-camera: Cross-location trends (e.g. urban corridors or regional networks).
- Route Analysis: Aggregate data along user-defined paths, with emissions per vehicle type.
Core Applications
- Traffic Density Estimation: By monitoring fluctuations in traffic volume, authorities can optimize road management and infrastructure planning.
- Traveler Count Estimation: To approximate the number of individuals traveling on a given road, additional parameters, such as the distribution of passenger versus heavy vehicles and average vehicle occupancy, can be incorporated into the analysis.
- Environmental Impact Assessment: The system generates visual analytics, including graphs and heat maps, to depict traffic flow dynamics and estimate CO₂ emissions with quantitative precision. It provides per-kilometer CO₂ emission metrics for each camera location, enabling granular environmental impact evaluation. Additionally, the route analysis function allows users to aggregate traffic and emissions data between two points, with the ability to force routes through specific waypoints. This feature provides total route distance, travel duration, and CO₂ emissions differentiated by vehicle type, supporting targeted sustainability measures.
- Enhanced Road Safety Measures: By identifying traffic congestion trends and high-risk areas, the system aids in optimizing traffic control strategies and accident prevention measures.
Overall, this traffic monitoring and analysis framework provides an evidence-based approach for improving road safety, optimizing urban mobility, and supporting sustainable transportation planning.
Reports:
Reports generated by the system fall into three main categories
- Single-Camera Reports
- Multi-Camera Reports.
- Route Analysis Reports.
The first two reports support time-based analysis, including hourly, daily, monthly, and yearly breakdowns.
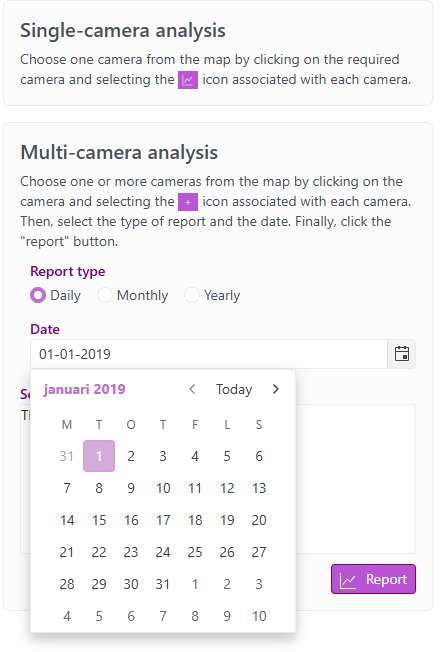
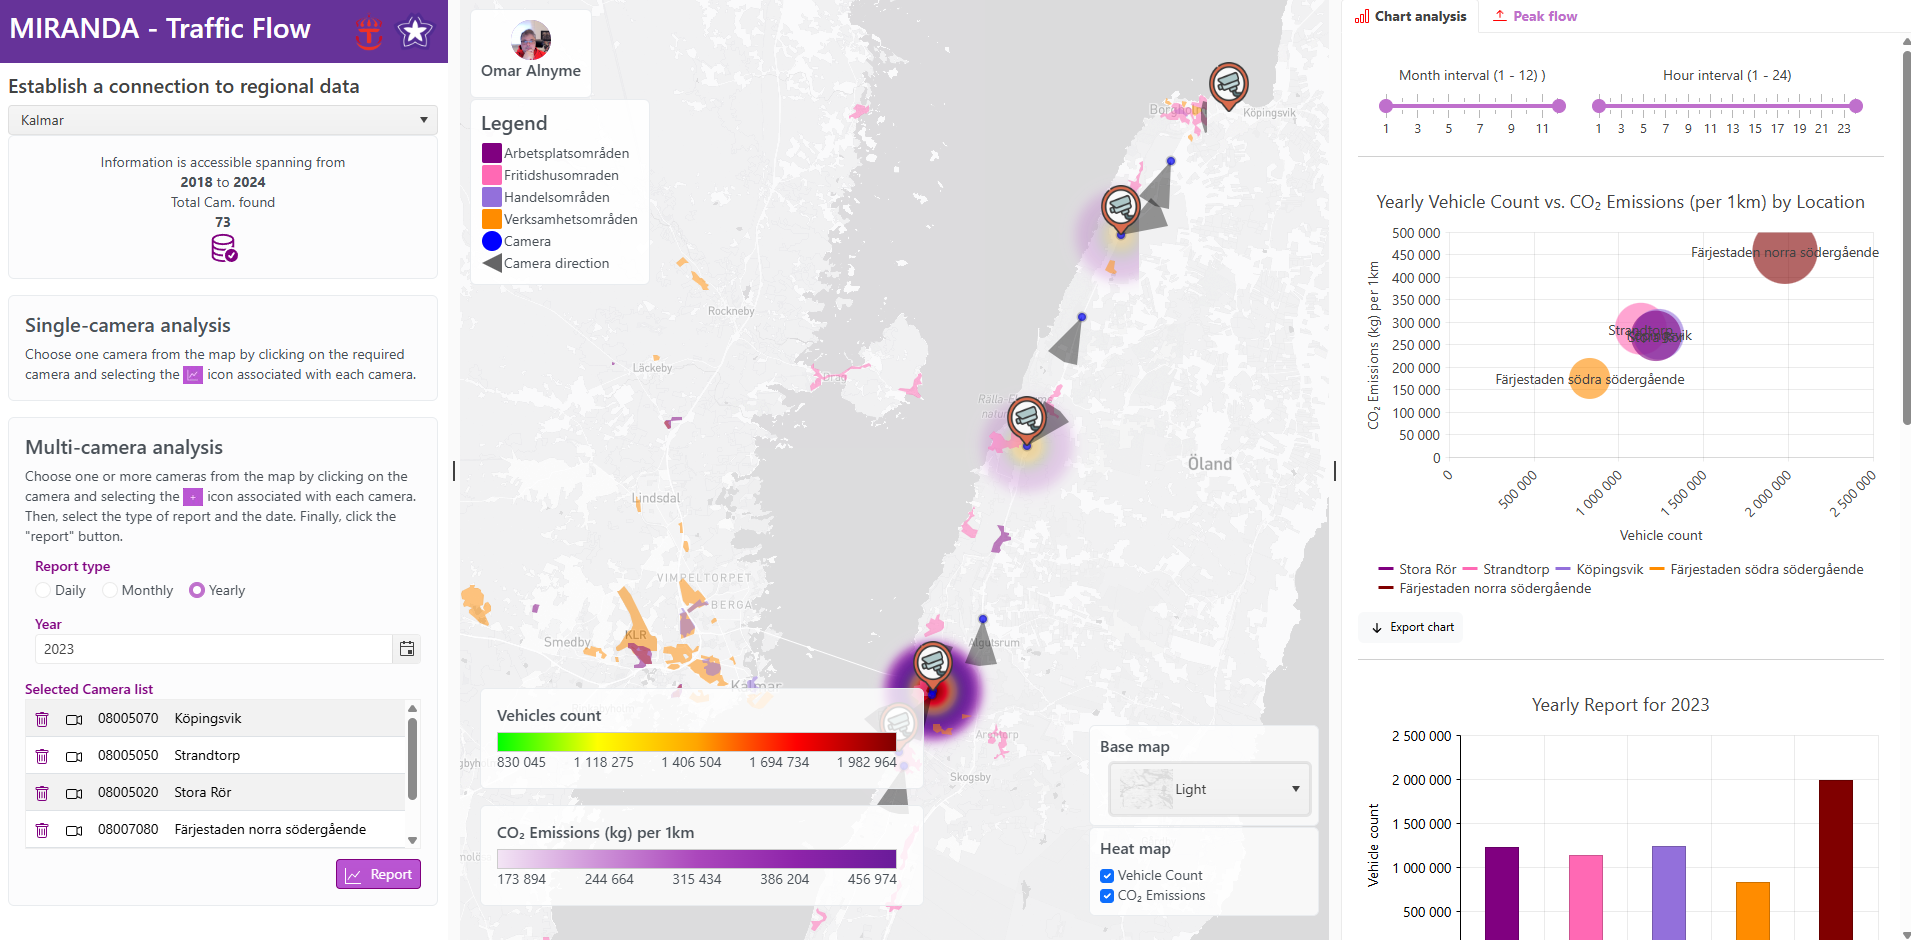
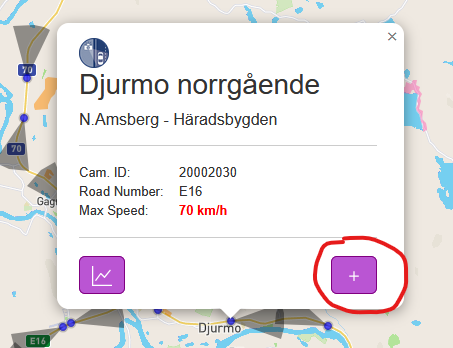
Multi-Camera Analysis
To choose multiple cameras, navigate the map to locate and click on the desired camera. Use the button labeled with a “+” icon to add the selected camera to your list of chosen cameras. Repeat this process for all cameras you wish to include in your analysis. Next, select the desired date, month, or year for your analysis, and then click on the “Report” button to proceed.
The analysis is conducted at hourly, daily, monthly, and annual intervals to provide a comprehensive evaluation of traffic dynamics. It assesses peak traffic patterns across weekends, weekdays, and monthly periods. Additionally, CO₂ emissions are estimated for the selected areas.
The system enables data filtration based on specific hourly, daily, monthly, and yearly intervals, allowing for precise temporal analysis.
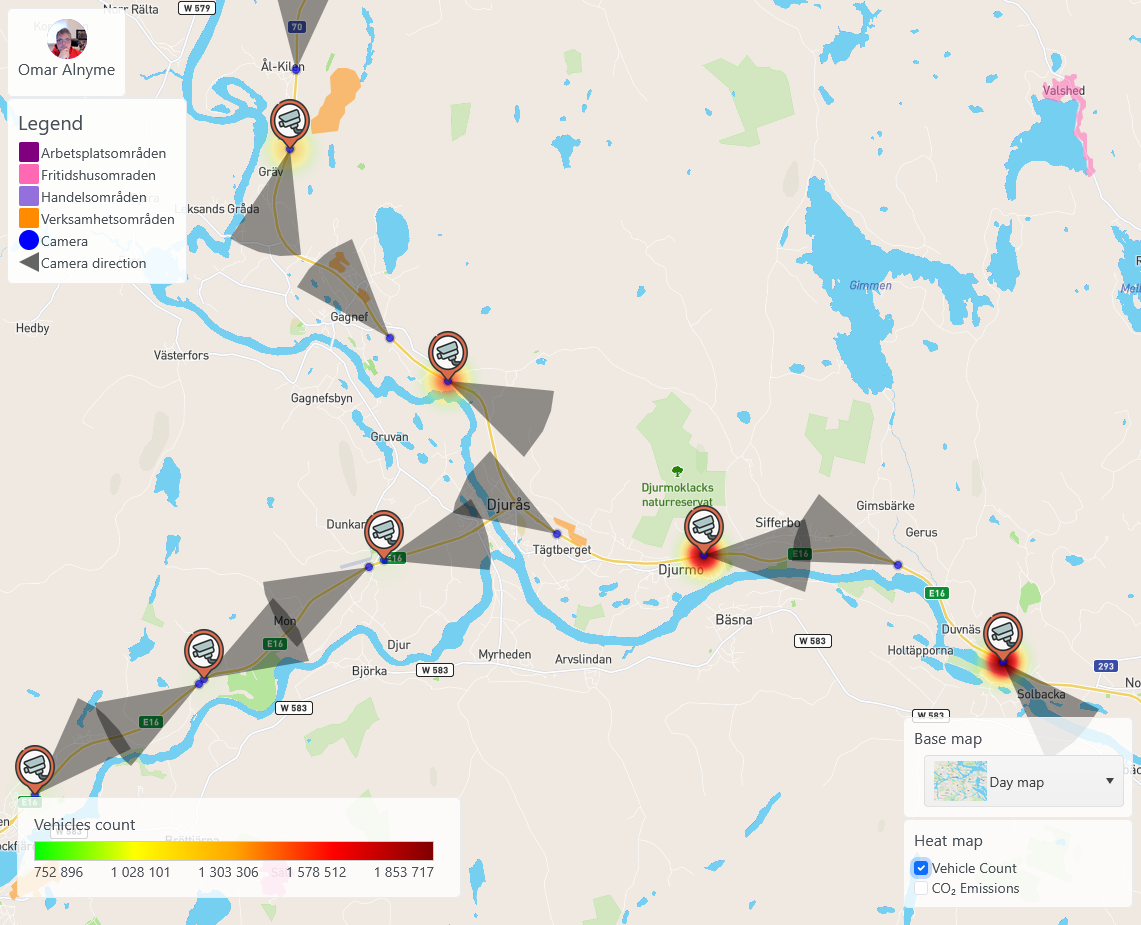
Heatmap – Vehicle Count
A heatmap is utilized to visualize traffic flow intensity, providing a spatial representation of vehicular movement patterns. The heatmap can be generated using different temporal filters, including hourly, daily, monthly, and yearly intervals. This analytical approach offers several benefits, such as identifying congestion hotspots, optimizing traffic management strategies, and facilitating data-driven urban planning decisions.
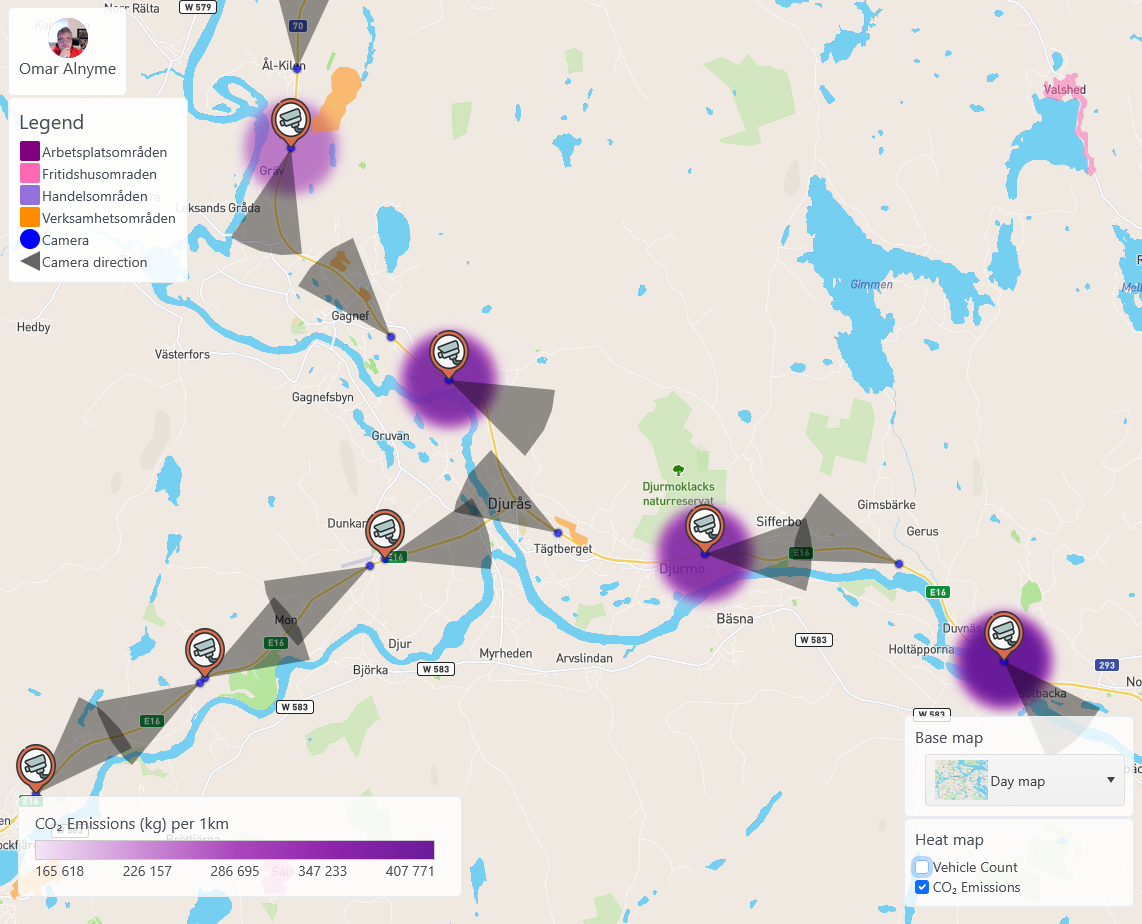
Heatmap – CO₂ Emission
A heatmap is used to visualize CO₂ emission intensity, providing a spatial representation of emission distribution across different areas. The heatmap can be generated using various temporal filters, including daily, monthly, and yearly intervals. This analytical approach offers several benefits, such as identifying high-emission zones, supporting environmental impact assessments, and aiding in the development of sustainable urban planning and traffic management strategies.
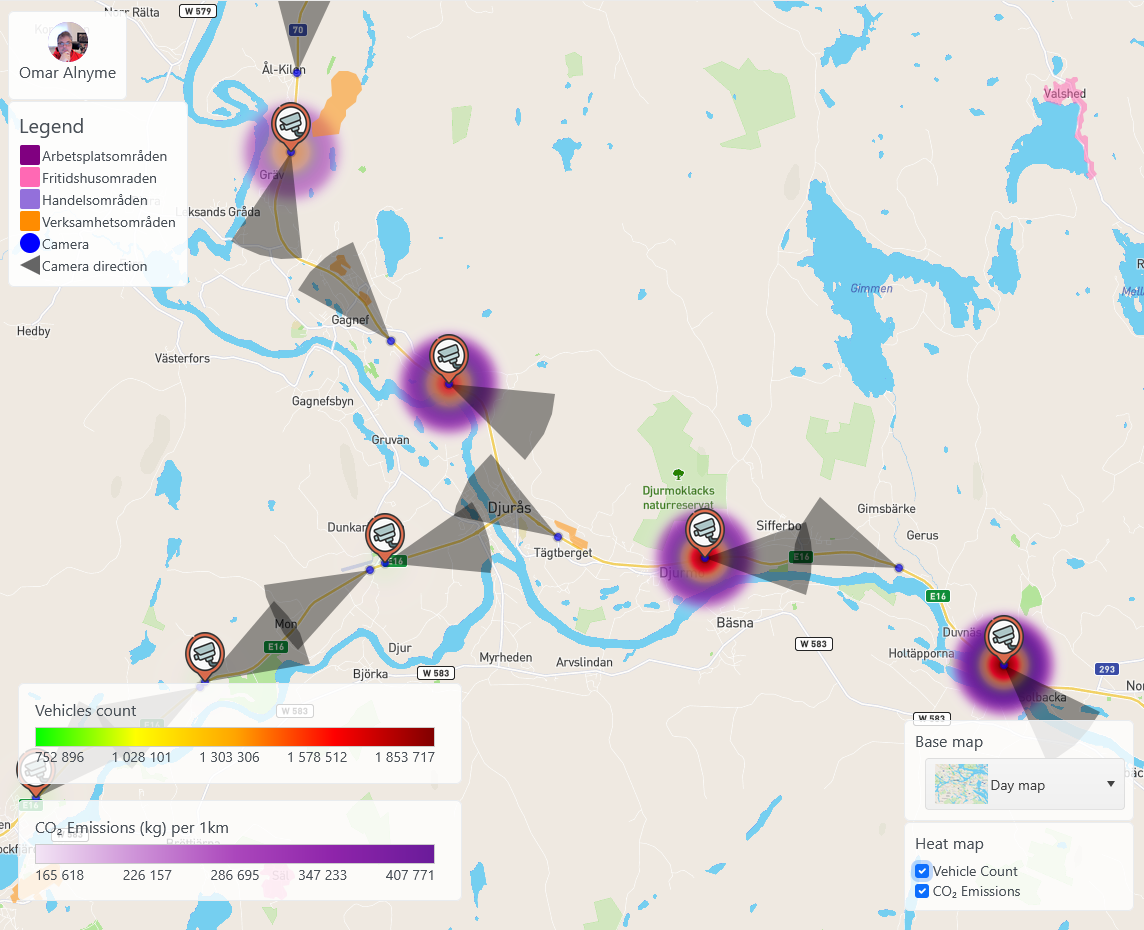
Heatmap – Vehicle Count & CO₂ Emission
A dual heatmap is used to simultaneously visualize vehicle count and CO₂ emission intensity, providing a comprehensive spatial representation of traffic flow and its environmental impact. The heatmaps can be generated using various temporal filters, including daily, monthly, and yearly intervals. This analytical approach offers several benefits, such as identifying high-traffic and high-emission zones, supporting environmental impact assessments, optimizing traffic management strategies, and aiding in the development of sustainable urban planning solutions.
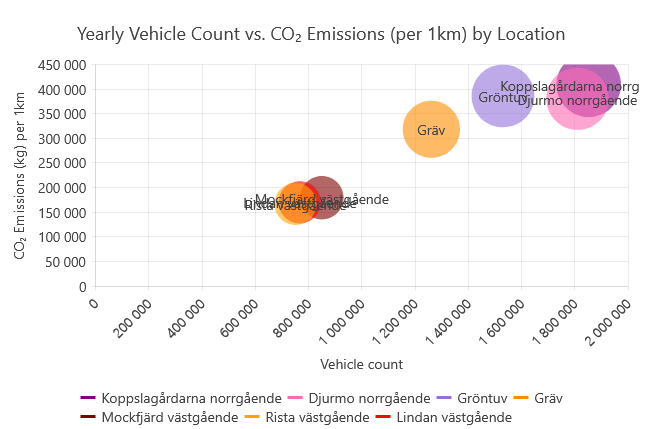
Vehicle Count VS Emission Chart
A bubble chart is utilized to represent the relationship between vehicle count and CO₂ emissions, with emissions weighted based on a speed factor to enhance accuracy. The chart can be generated using various temporal filters, including daily, monthly, and yearly intervals. This analytical approach offers several benefits, such as identifying trends in traffic volume and emissions, assessing the impact of vehicle speed on pollution levels, supporting environmental impact assessments, optimizing transportation planning, and aiding in the development of sustainable urban mobility strategies.
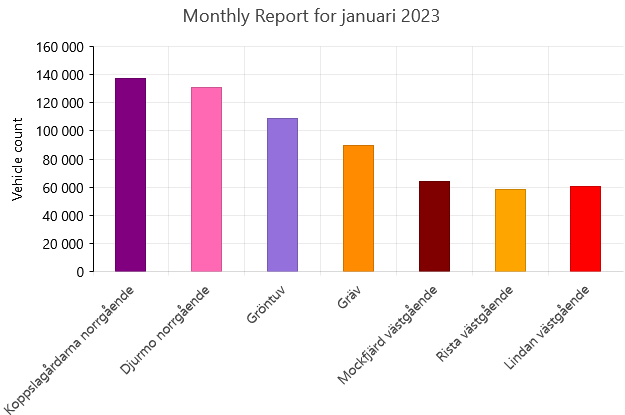
Vehicle Count – Column chart
A column chart is used to visualize vehicle count by safety camera locations, providing insights into traffic volume across different monitored areas. The chart can be generated using various temporal filters, including hourly, daily, monthly, and yearly intervals. This analytical approach offers several benefits, such as identifying high-traffic areas, assessing the effectiveness of traffic enforcement, supporting transportation planning, optimizing road safety measures, and aiding in urban mobility improvements.
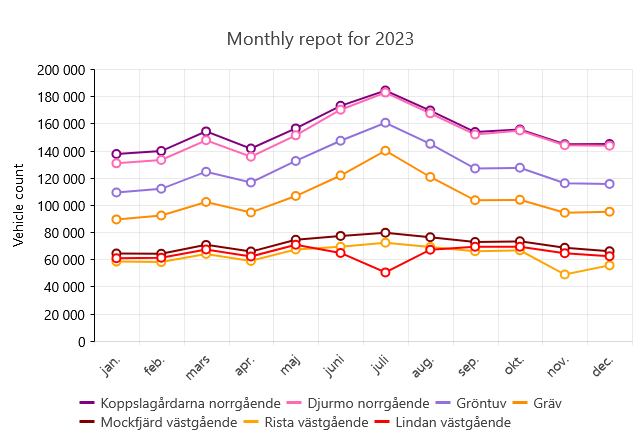
Vehicle Count – Line Chart
A line chart is used to visualize vehicle count trends for each safety camera location, providing insights into traffic flow variations over time. The chart can be generated using various temporal filters, including hourly, daily, monthly, and yearly intervals. This analytical approach offers several benefits, such as identifying long-term traffic trends, detecting seasonal or peak-hour variations, assessing the impact of traffic management measures, and supporting data-driven urban mobility planning.
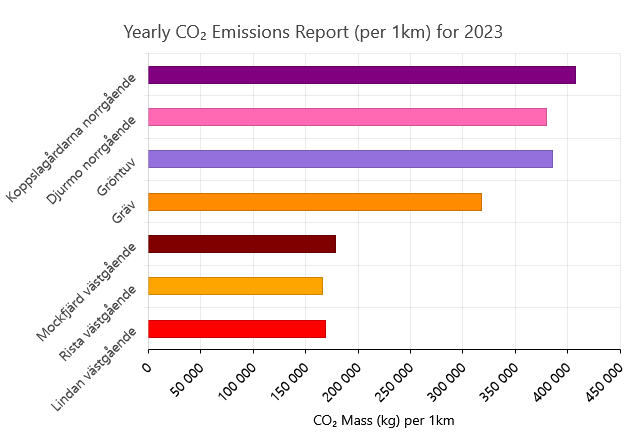
CO₂ Emission – Bar Chart
A bar chart is used to visualize CO₂ emissions for each safety camera location, providing a comparative view of emissions across different monitored areas. The chart can be generated using various temporal filters, including daily, monthly, and yearly intervals. This analytical approach offers several benefits, such as identifying high-emission zones, evaluating the environmental impact of traffic in specific areas, supporting sustainability initiatives, and assisting in the development of targeted environmental policies and traffic management strategies.
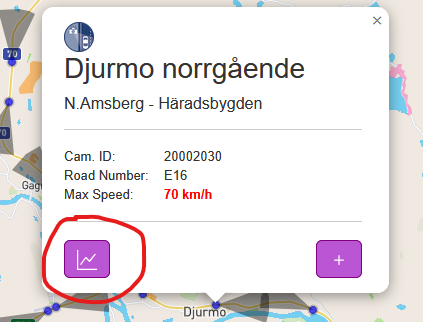
Single-Camera Analysis
To generate the report, select the designated camera from the map and and click the chart icon button.
The analysis is performed at hourly, daily, and monthly intervals, providing a comprehensive assessment of traffic dynamics. It includes evaluations of peak traffic patterns across weekends, weekdays, and monthly periods.
The system enables data filtration based on specific months and hourly intervals, allowing for precise temporal analysis.
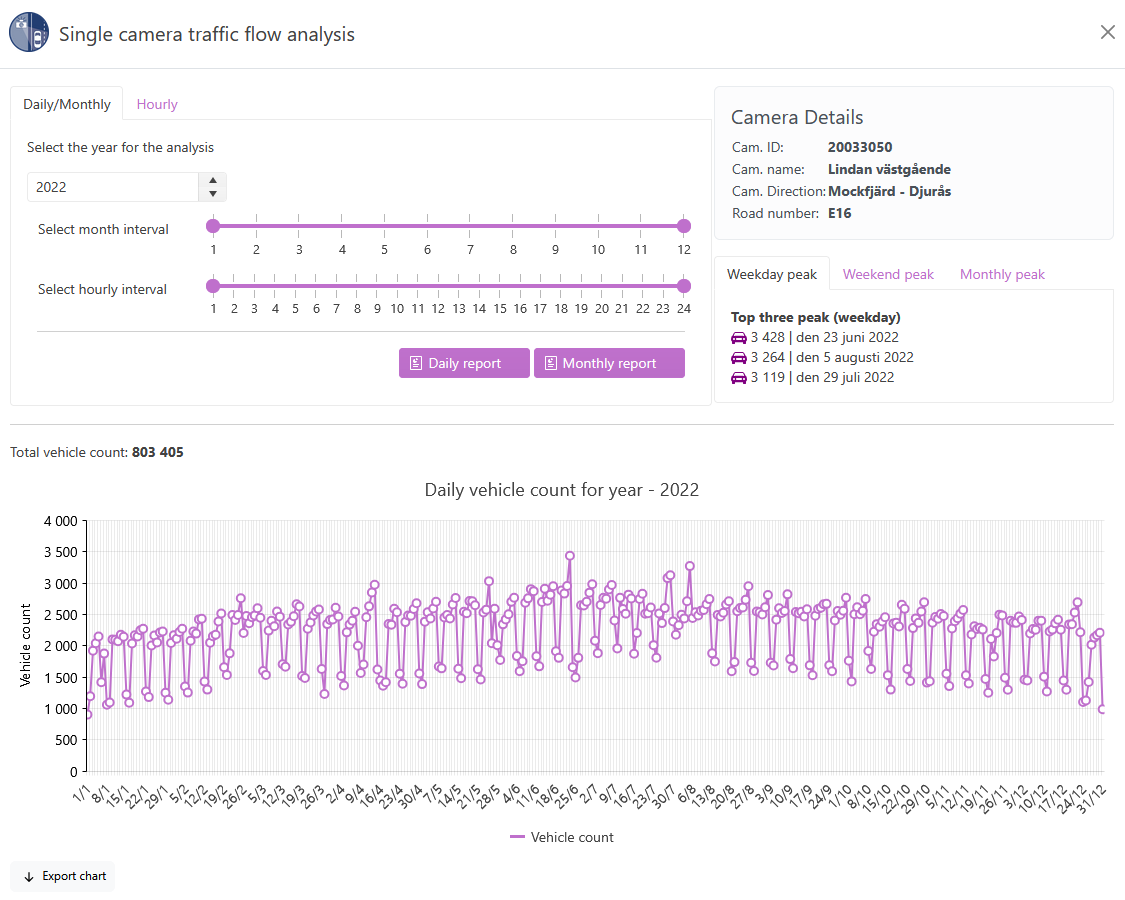
Daily Traffic Flow Analysis
- Day-to-Day Variability Assessment: Identifies fluctuations in traffic patterns across different days, improving scheduling and resource allocation.
- Traffic Management Planning: Supports decisions on road maintenance, lane closures, and alternative route planning.
- Event Impact Analysis: Helps predict and manage traffic changes due to planned events, road construction, or weather conditions.
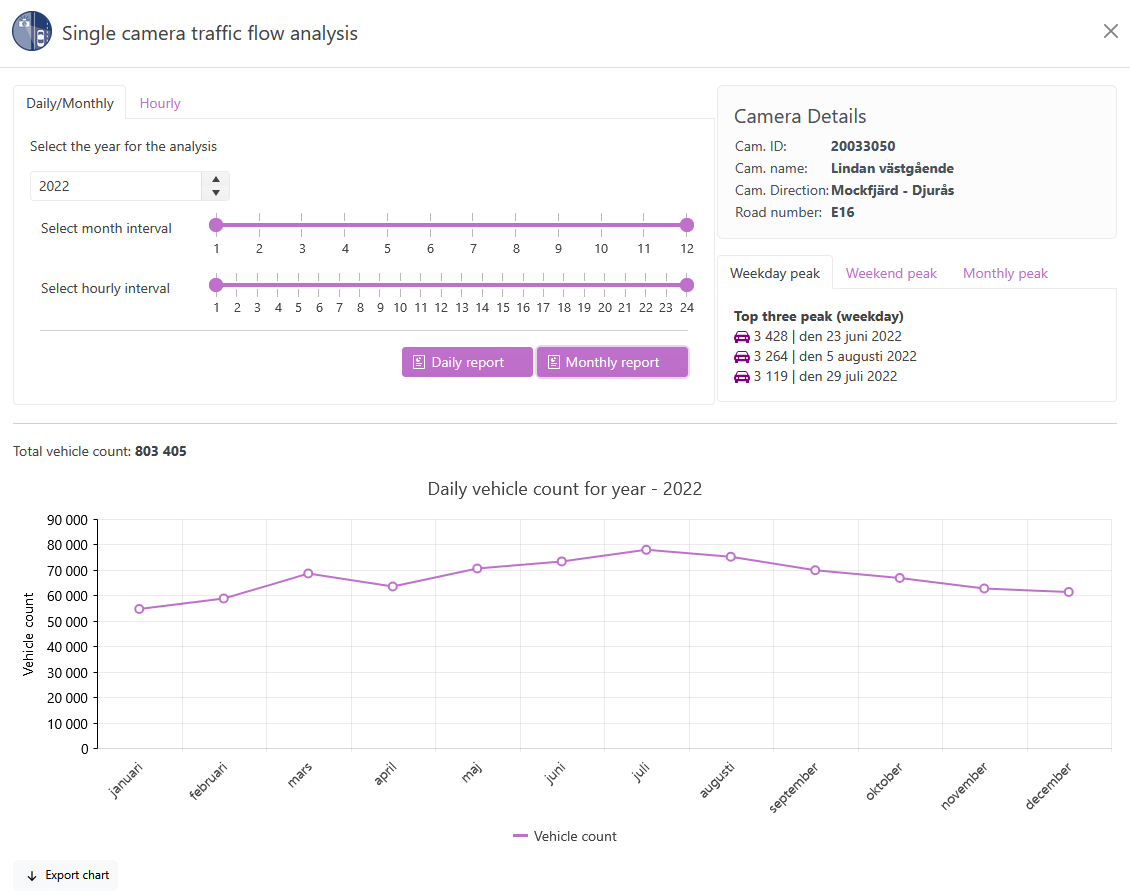
Monthly Traffic Flow Analysis
- Long-Term Trend Analysis: Helps in understanding seasonal variations and long-term traffic growth trends.
- Infrastructure Planning: Supports the design and expansion of roads, bridges, and transportation networks based on traffic demand.
- Economic and Business Insights: Assists businesses in understanding customer movement patterns, optimizing delivery routes, and planning operational hours.
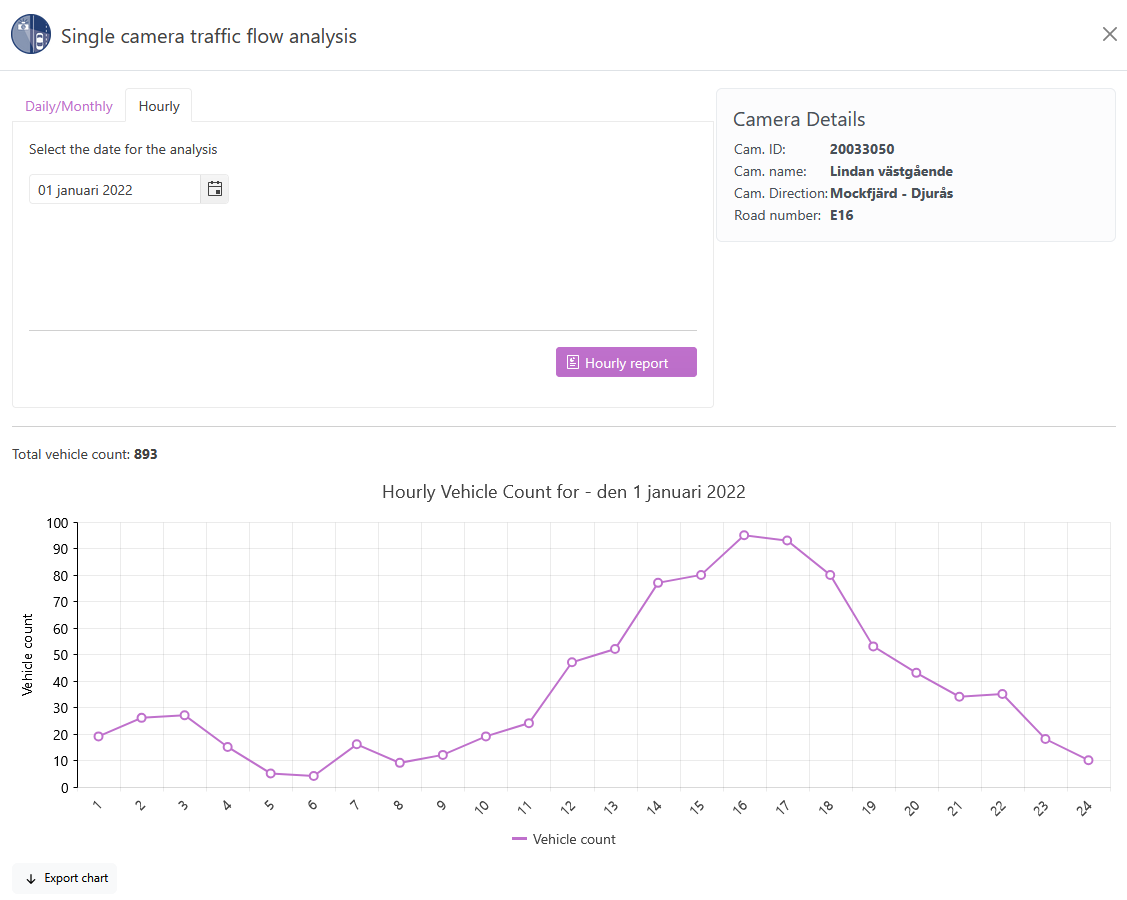
Hourly Traffic Flow Analysis
- Peak Hour Identification: Helps determine rush hours, allowing for better traffic signal timing and congestion management.
- Public Transport Efficiency: Assists in scheduling buses, trains, and ride-sharing services based on demand fluctuations.
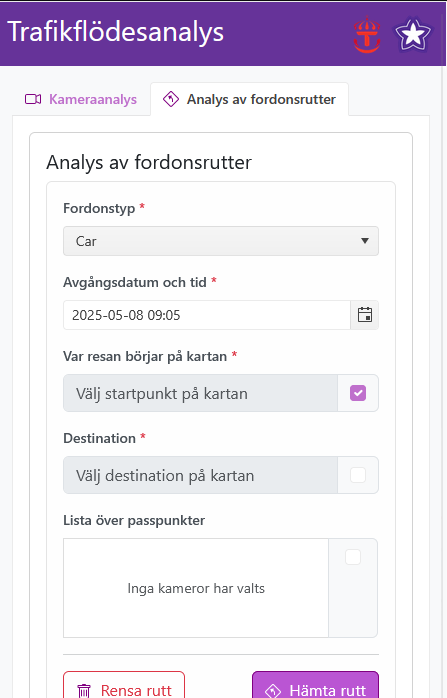
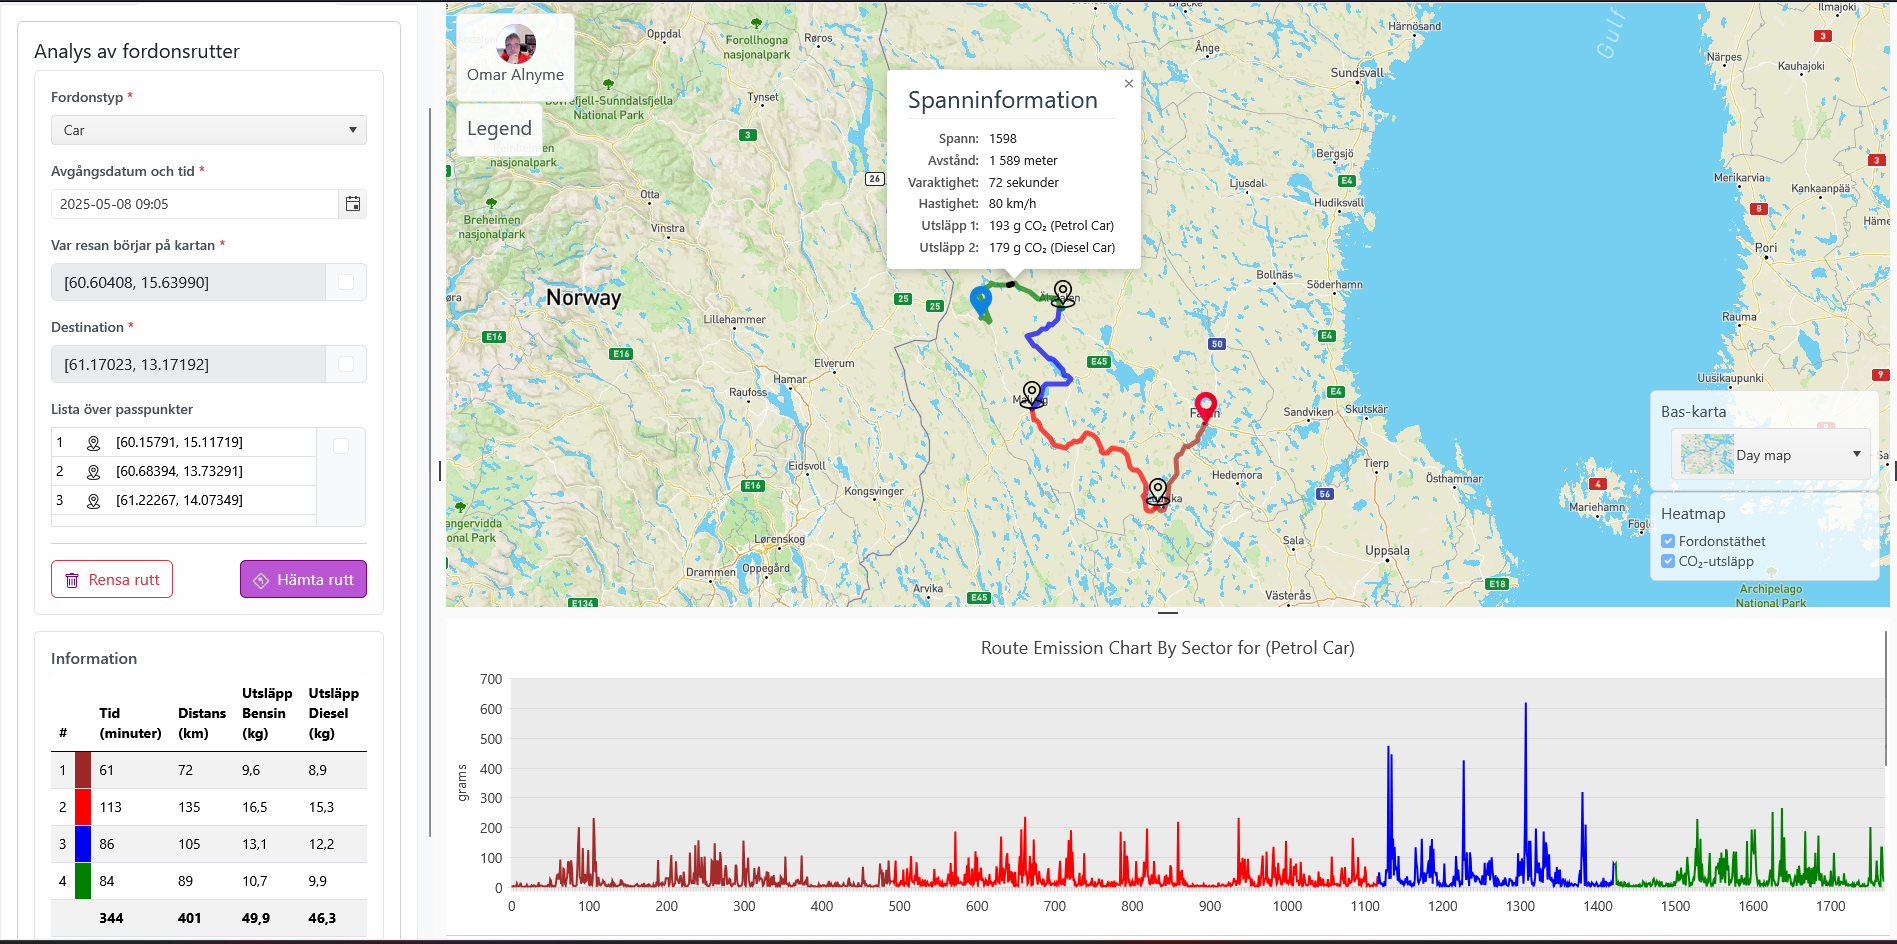
Route Analysis
This feature helps users plan routes between locations while estimating the CO₂ emissions produced by different vehicle types. Whether you’re optimizing a delivery route, planning a road trip, or analyzing transportation emissions, this tool provides detailed insights into your journey’s environmental impact.
Key Features
Route Planning
- Interactive Point Selection:
- Intuitive map interface for precise location selection
- Start and end point designation for essential route parameters
- Visual feedback when points are successfully placed
- Intermediate Pass Points:
- Flexible pass-through point system for route customization
- Sequential processing of intermediate stops
- Dynamic route recalculation with each added waypoint
- Intelligent Path Calculation:
- Generates optimal routes based on:
- Vehicle type specifications
- Point sequence logic
- Real-world road network data
- Automatically determines most efficient path through all designated points
- Generates optimal routes based on:
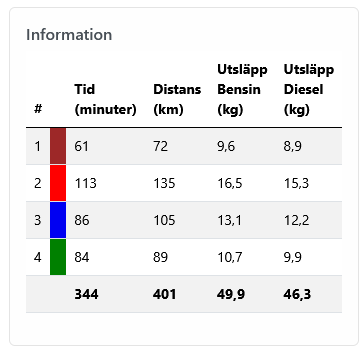
Aggregated & Detailed Reporting
- View total emissions for the entire route or drill down into each segment and span for granular insights.
- Adjust waypoints dynamically to optimize for distance, time, or emissions.
CO₂ Emissions Estimation
- Multi-Vehicle Comparison: Calculate emissions for different vehicle types (e.g., cars, trucks, Buses).
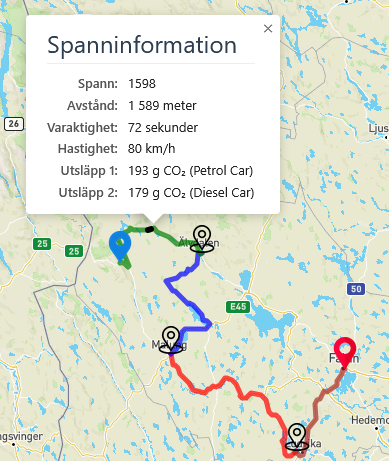
- Section-by-Section Breakdown: If pass points are added, the route is divided into segments (start → first pass point → second pass point → … → end).
- Span-Level Details: Each segment is further split into spans, with metrics including:
- Distance traveled
- Average speed
- Travel duration
- CO₂ emissions
Configuring the Route analysis
To generate a customized route analysis, you must first select the vehicle type, then define the journey’s start and end points. You can further optimize the path by specifying intermediate pass-through locations.
Route Setup Instructions
- Select Vehicle Type:
- Choose the vehicle type (e.g., car, truck, bus, private bus) for which the route will be optimized.
- Define Required Points:
- Start Point: Drop a pin on the map to set the route origin.
- End Point: Drop a second pin to set the route destination.
- Optional Waypoints (Pass-Through Points):
- To guide the route through specific locations, select the “Pass Through” option.
- Drop additional pins for each required intermediate stop.
- The system will generate a path that begins at the start point, follows the sequence of pass-through points, and concludes at the end point.
Route Planning
The system enables dynamic route creation between user-defined start and end points, with visualization directly plotted on the interactive map. Each generated route is accompanied by comprehensive performance metrics, including:
Key Output Parameters:
- Selected vehicle type and specifications
- Calculated travel time (with traffic considerations)
- Total travel distance
- Estimated CO₂ emissions based on vehicle profile
The interface provides:
- Real-time route rendering with clear waypoint markers
- Auto-generated analysis table showing quantitative metrics
- Responsive recalculations when modifying any parameter
All routing calculations incorporate:
- Up-to-date road network data
- Vehicle-specific performance characteristics
- Environmental impact modeling
- Optimal pathfinding algorithms
Last updated: