

The geo-economic analysis model leverages financial datasets from corporate entities to elucidate economic activities associated with tourism. This analytical framework integrates geospatial and economic variables, enabling users to delineate study areas at multiple spatial scales such as counties, municipalities, or custom-defined areas through an interactive, map-based interface. Furthermore, the model incorporates a dynamic spatial selection feature, allowing users to define study areas based on travel distance, calculated within a specified timeframe and mode of transportation (e.g. driving, walking, cycling, or public transit). This functionality enhances the precision of spatial analyses by accounting for accessibility and travel behavior, which are critical factors in assessing tourism’s economic footprint.
The model generates comprehensive insights by processing financial metrics, including total revenue (turnover) and employee headcounts, alongside derived tourism-specific contributions. These contributions are expressed as proportions of the total turnover and employment attributable to tourism-related activities. Outputs are organized into detailed reports, segmented by user-selected regions, municipalities, or custom areas, and include the following metrics:
- Total Turnover: Aggregate revenue across the selected area, with breakdowns by economic sector (e.g. hospitality, retail, transportation, activity, booking, restaurant).
- Total Employee Count: Overall employment figures, similarly disaggregated by sector.
- Tourism Share: The fraction of turnover and employment directly linked to tourism, calculated as a percentage of the totals, with sector-specific granularity.
- Growth Rates: Annual or periodic growth trends, both overall and by sector, to identify economic expansion or contraction.
- Revenue per Employee: A productivity metric computed by sector, offering insights into labor efficiency and economic value generation.
- Population Demographics: Age-stratified population data (in 5-year increments) for the selected area, providing context for workforce availability and market demand.
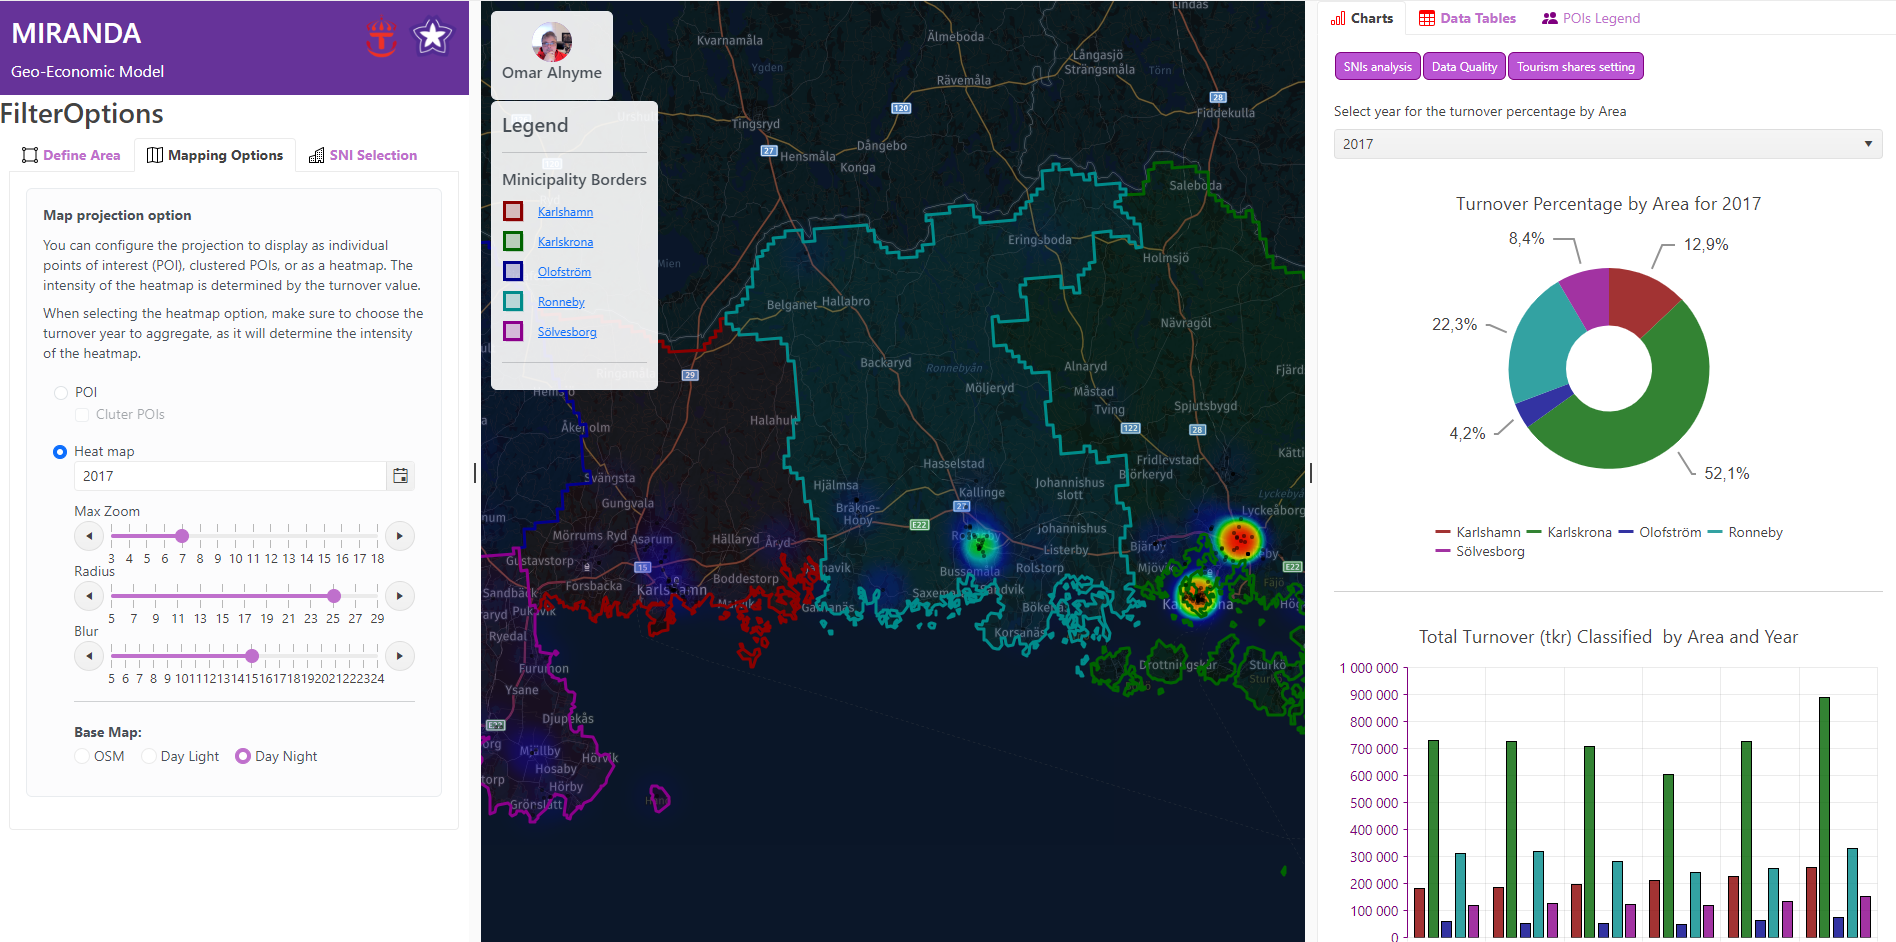
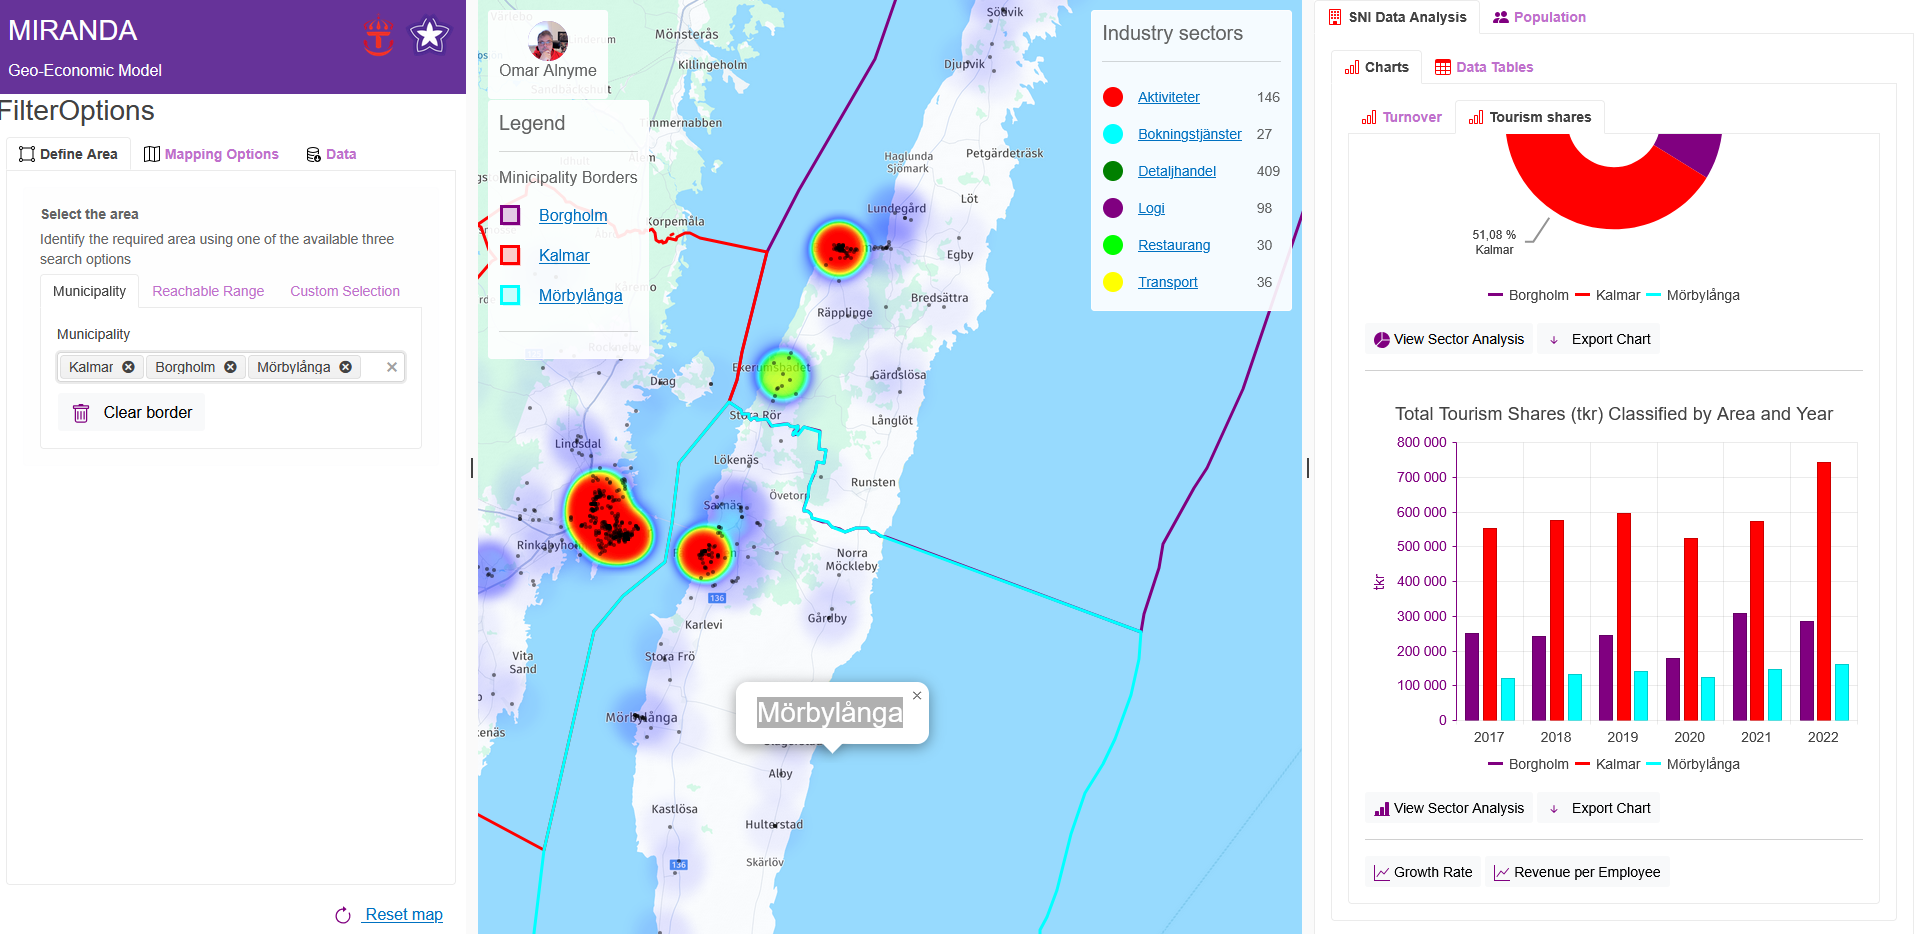
These outputs are visualized through an array of formats: charts, tables, heatmaps, and cluster maps facilitating intuitive interpretation and spatial pattern recognition. Heatmaps, for instance, highlight areas of concentrated economic activity, while cluster maps reveal geographic groupings of tourism-related businesses.
The tourism share estimates are initially derived from national averages, ensuring a standardized baseline. However, the model offers flexibility, allowing users to adjust these percentages for specific areas based on local expert knowledge. This customization capability enhances the model’s adaptability to regional variations in tourism dependency.
Applications and Broader Implications
This model serves as a robust tool for researchers, urban planners, and policymakers seeking to understand and enhance tourism-driven economies. Its outputs provide information for infrastructure development, marketing strategies, and workforce training programs, while its spatial precision supports sustainable tourism planning by identifying areas of over- or under-utilization. By bridging financial data with geographic context, the model advances the scientific study of tourism economics, offering a replicable and adaptable framework for global use.
Scientific Enhancements and Benefits
Data-Driven Precision
By integrating corporate financial data with geospatial analysis, the model provides an evidence-based approach to quantifying tourism’s economic impact, reducing reliance on anecdotal or qualitative assessments
Scalability and Flexibility
The ability to analyse data at multiple geographic levels combined with user-defined travel distance parameters makes the model applicable to diverse contexts, from rural counties to urban centers or bespoke tourism zones
Economic Insights
Sector-specific breakdowns of turnover, employment, and growth rates enable stakeholders to identify key drivers of tourism economies, supporting targeted policy or investment decisions
Labor and Productivity Analysis
Revenue-per-employee metrics offer a lens into workforce efficiency, aiding businesses and policymakers in optimizing resource allocation
Demographic Context
Age-class population data enriches the analysis by linking economic activity to labor supply and consumer demand, critical for long-term planning
Customizability
Adjustable tourism shares empower users to refine the model with local knowledge, improving accuracy in regions where national averages may not apply
Visualization for Decision-Making
The use of heatmaps and cluster maps transforms raw data into actionable insights, allowing users to visually pinpoint high-impact zones and spatial trends
Economic Analysis Based on Area Selection Methods: Region, Municipality, Custom Selection, and Travel Distance
In this section, we will systematically analyse economic factors within a clearly defined study area. The area will be selected using four approaches: (1) region (2) municipal boundaries, (3) a custom-drawn zone, and (4) travel time from a selected point. Each method offers a different way to examine how economic activities are distributed geographically, ensuring a more thorough and balanced understanding of economic conditions for the selected area/s. By combining these approaches, we aim to reduce bias and improve the accuracy of our findings across varying spatial scales.
Municipality Boundaries
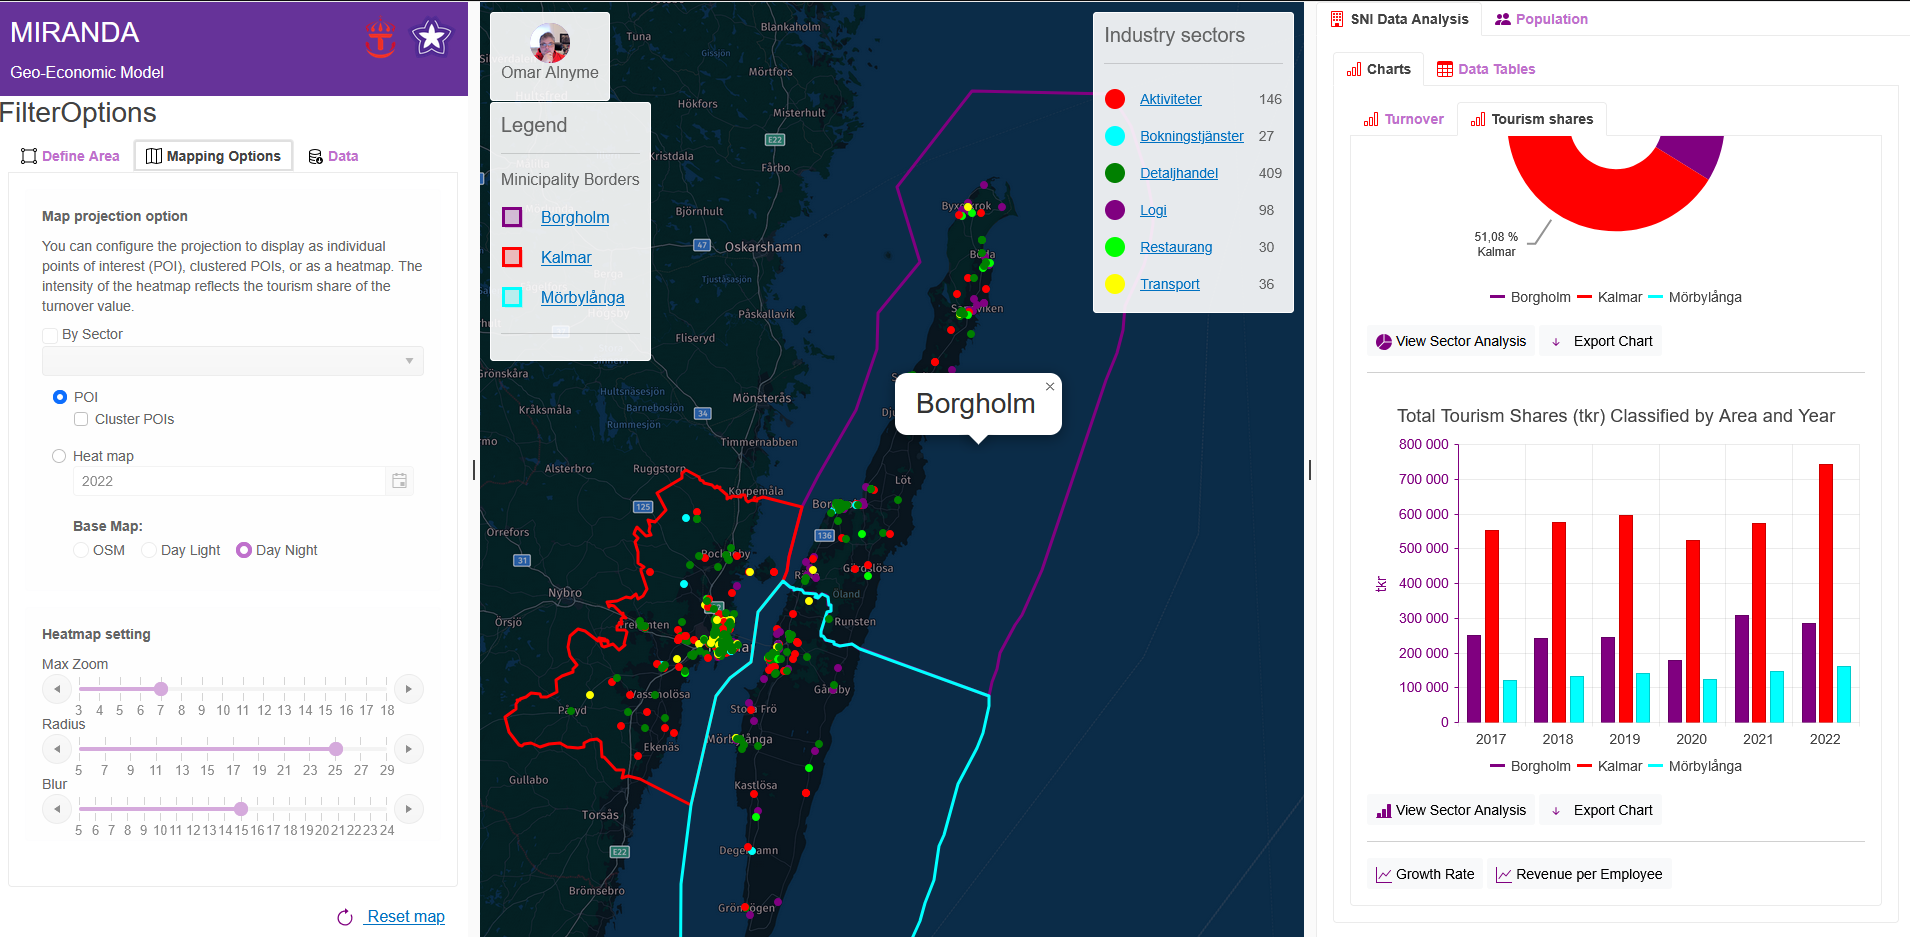
Economic analysis of three municipalities in Kalmar County: Kalmar, Borgholm, and Mörbylånga. Users can select multiple municipalities, even from different regions, to compare key tourism performance measures. This flexible approach allows for a clearer understanding of differences, patterns, and success factors in tourism activity across areas. By customizing selections, the tool ensures accurate and adaptable comparisons, helping users evaluate how tourism performs under varying geographic and administrative conditions.
Custom Selected Area
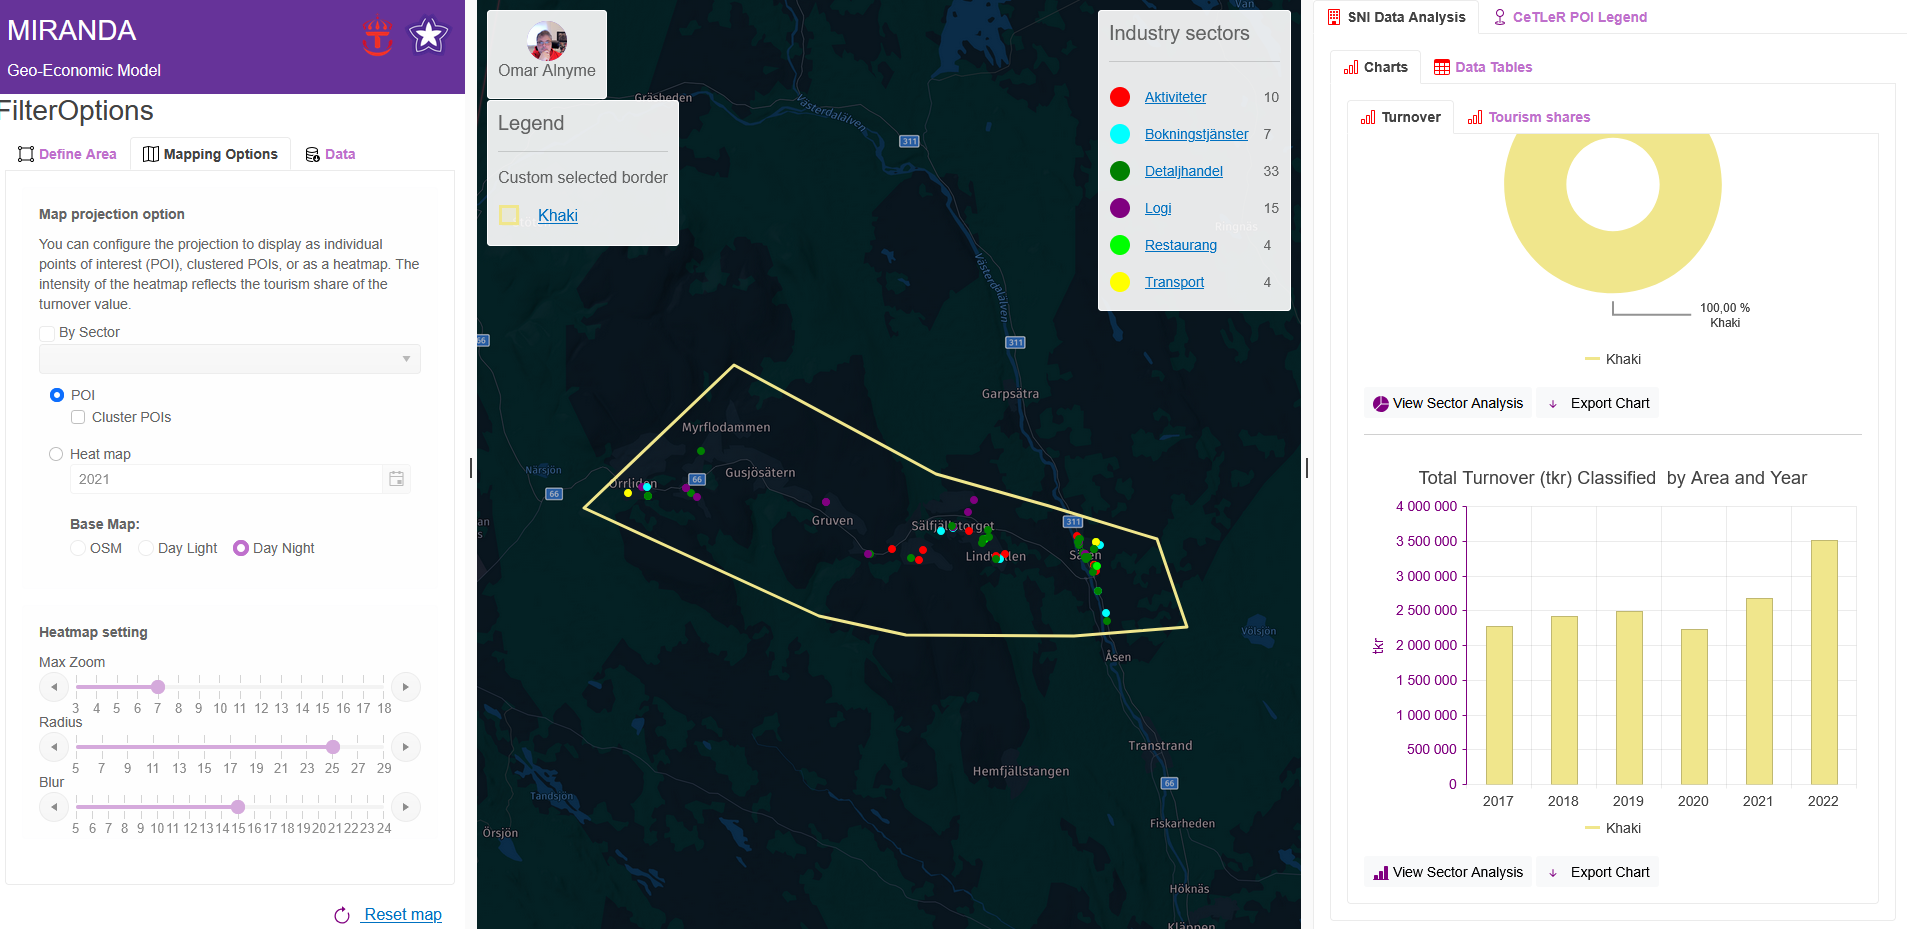
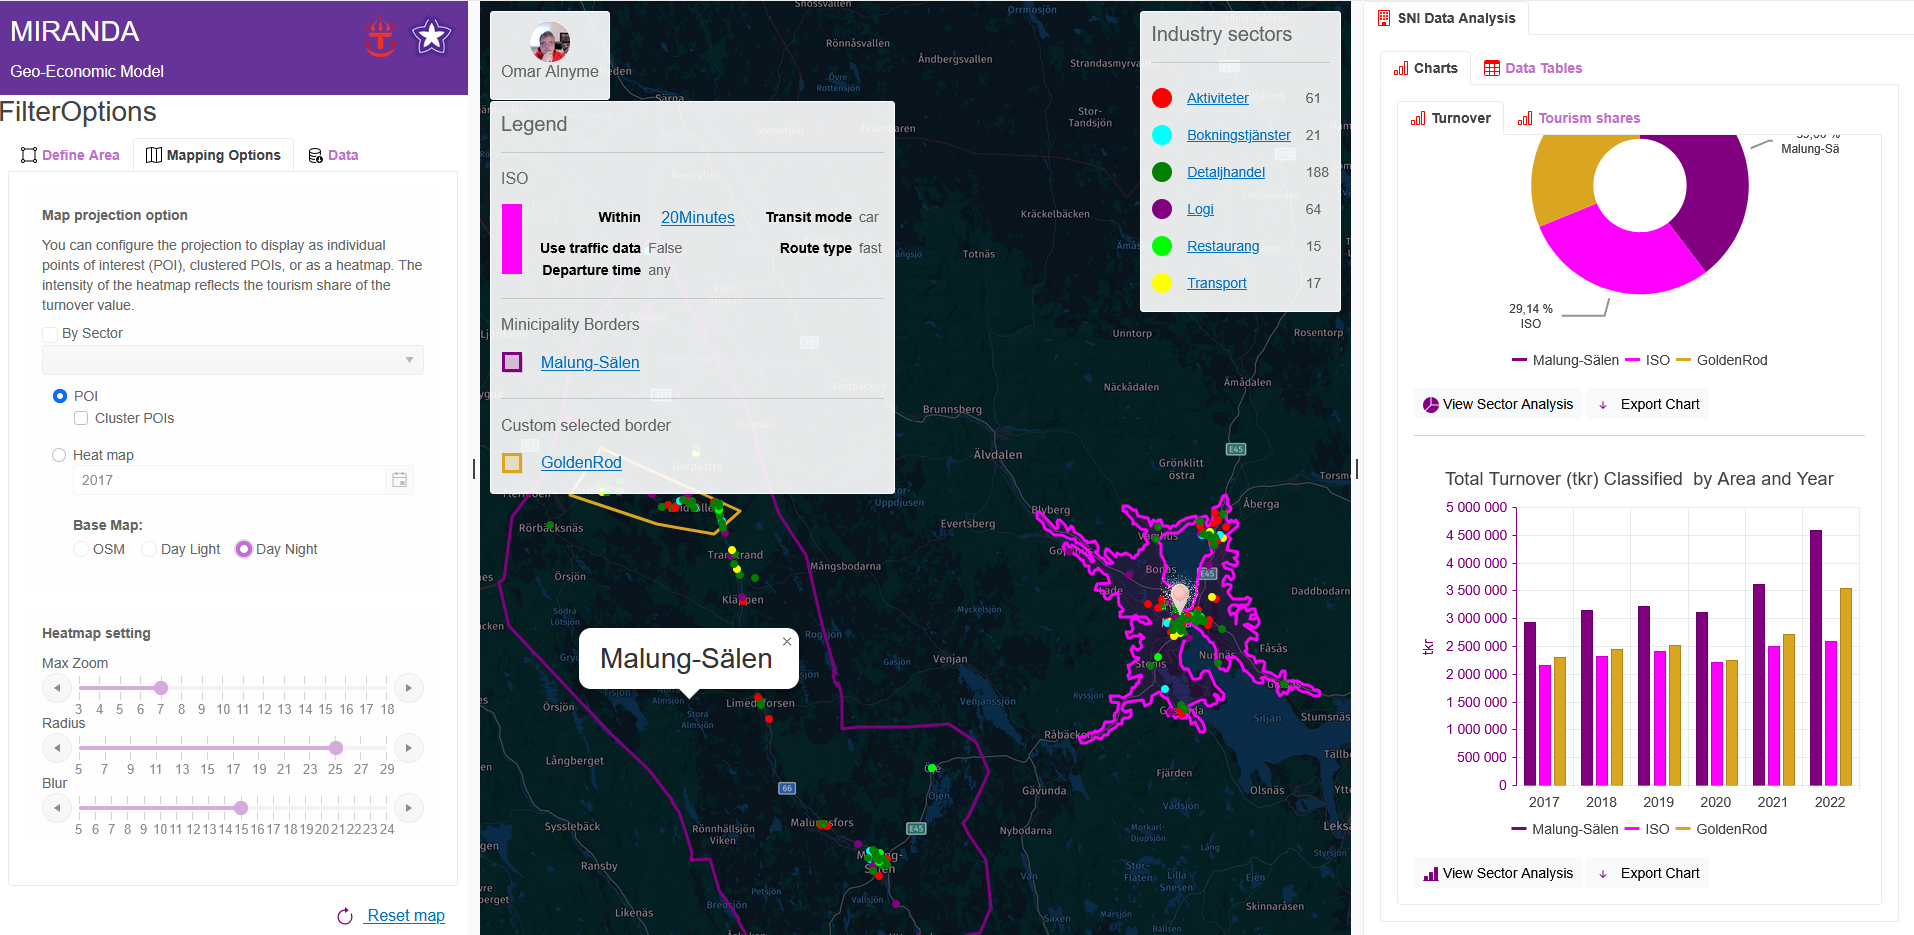
Economic analysis of Malung-Sälen using a custom-defined study area instead of traditional municipal borders. By focusing on specific measurable factors, the approach avoids oversimplified data from fixed administrative boundaries. Custom geographic parameters enable detailed insights into localized economic patterns, helping identify trends and challenges tied to performance within the area.
Travel Distance
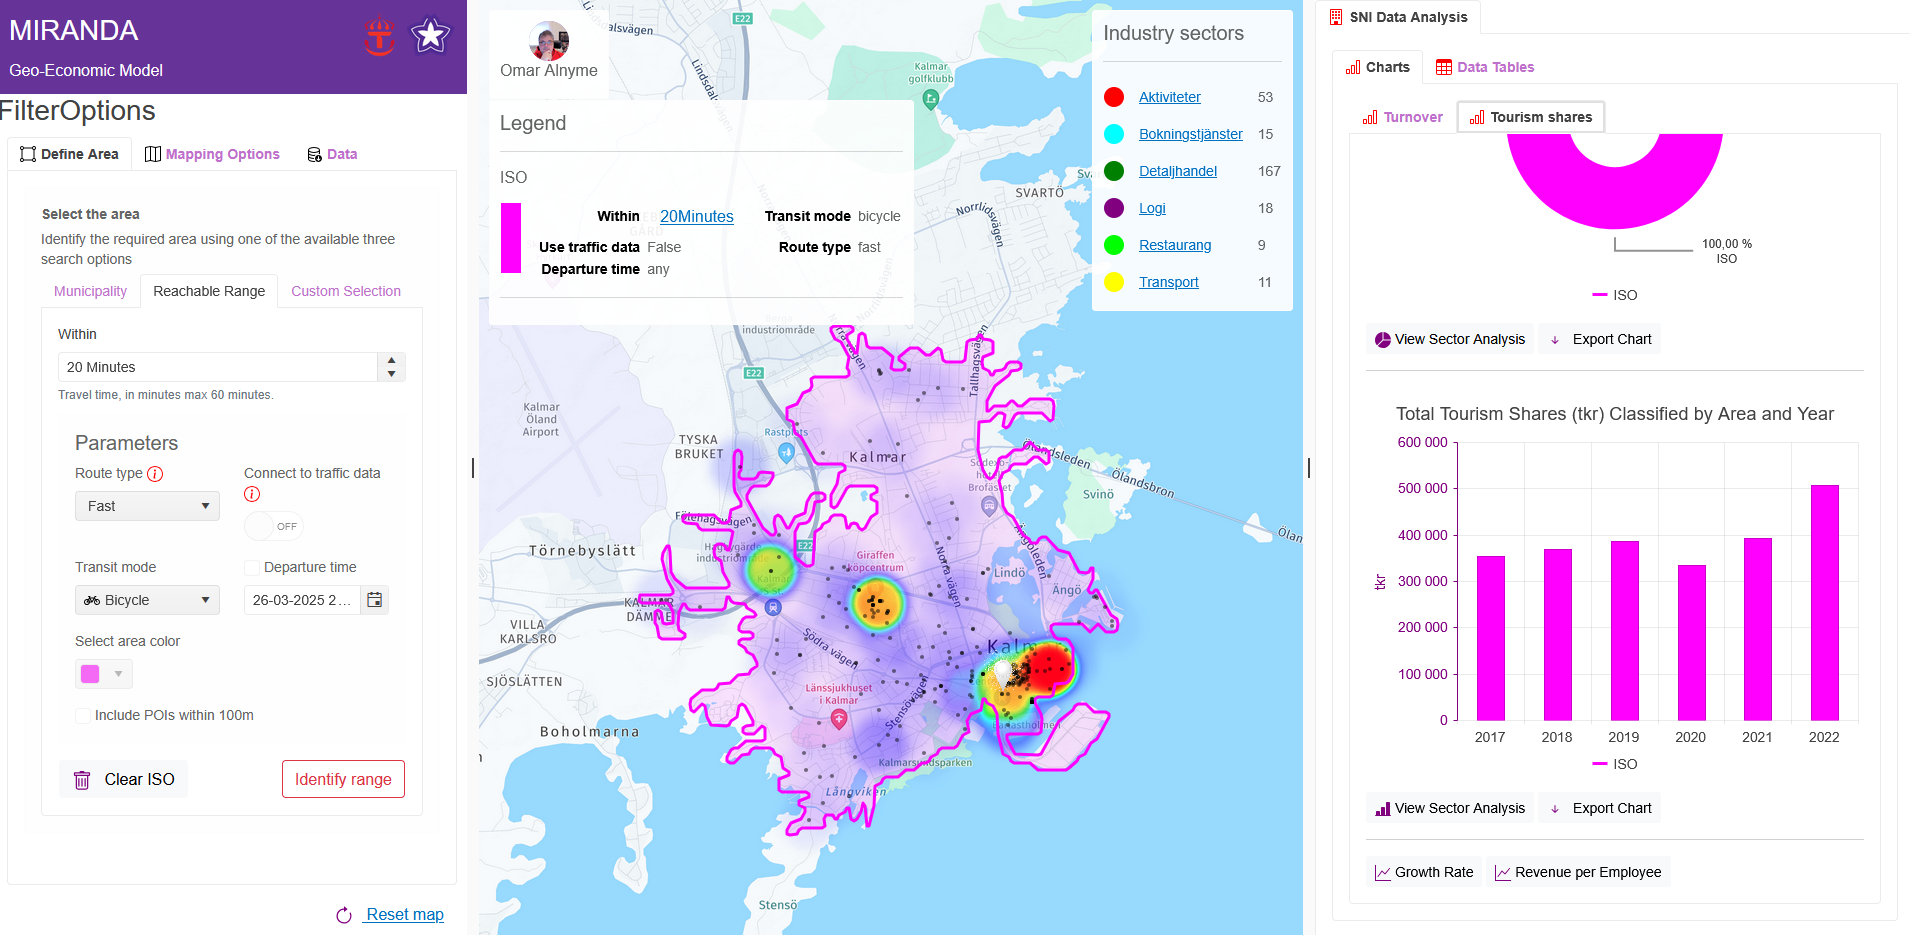
Analyses the tourism sector around Kalmar Central Station, focusing on areas reachable within a 20-minute bike ride. It evaluates how accessible tourism-related businesses and services (e.g. logistic, retail, restaurants, etc.) are within this zone and their economic impact. The goal is to understand how bike-friendly infrastructure supports tourism and local business success.
Mix Approach
This study analyses the economy of three areas: the entire Malung-Sälen municipality, a specific zone within Sälen, and locations within a 20-minute drive from Mora’s town center. Using a mix of data and real-world insights, we explore how travel times, infrastructure, and local conditions shape economic activity. The goal is to identify ways to support community growth and improve planning.
Figures and Tables
The analytical framework employs data visualization to examine total turnover within tourism-dependent industries, alongside workforce distribution and the proportional contribution of tourism revenue. This includes a comparative breakdown of overall turnover and the tourism-specific share of total turnover, presented through segmented charts for clarity. These comparative analyses enable a granular assessment of sectoral performance, highlighting tourism’s economic impact relative to overall business activity.
Turnover Distribution Across Selected Municipalities
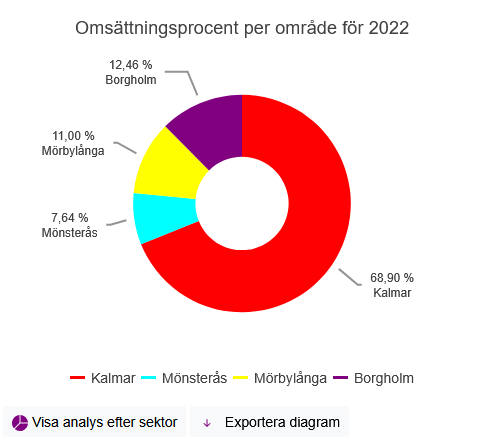
The ‘Turnover Share by Municipality’ chart displays the percentage of total revenue contributed by each area (e.g. Kalmar at 68.9% in 2022), highlighting economic concentration and municipal disparities. By comparing these shares across multiple years, stakeholders can track shifts in market dominance, identify emerging growth areas (e.g. rising turnover in Mörbylånga), and allocate resources strategically. The optional sector-level analysis further reveals which industries drive regional performance, enabling targeted interventions.
Turnover Distribution by Industry Sector for Each Selected Area
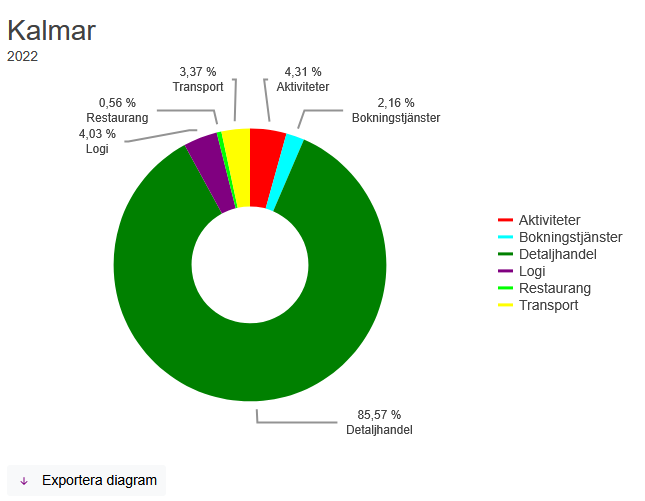
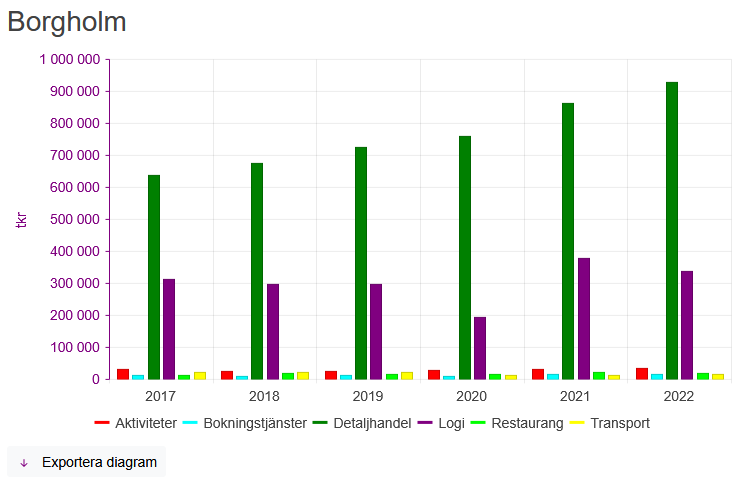
The “Turnover Distribution by Industry Sector for Each Selected Area” chart provides a detailed comparison of revenue streams across different industries within specific areas. This visualization helps identify which sectors drive economic activity in each area, enabling businesses and policymakers to spot strengths, weaknesses, and investment opportunities. By revealing sectoral trends at a regional level, it supports data-driven decisions for market expansion, resource allocation, and targeted economic development strategies.
Turnover and Employee Count by year for Each Selected Area
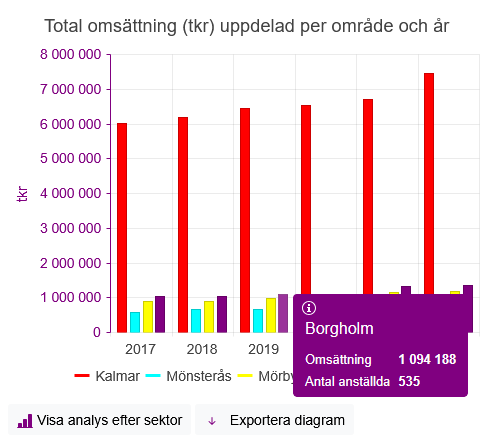
The “Turnover and Employee Count by Year for Each Selected Area” chart tracks the relationship between revenue growth and workforce changes over time across different regions. This dual-axis visualization reveals whether business expansion aligns with employment trends, helping identify areas of efficient scaling or potential over/under-staffing. By comparing these metrics annually, stakeholders can assess long-term performance patterns, evaluate labor productivity, and make informed decisions about regional investments or operational adjustments.
Sector-Specific Performance Metrics: Turnover and Employment Trends by Region and Year
This comprehensive visualization analyses industry performance across multiple dimensions, tracking both financial and workforce metrics through time and geography. By presenting turnover and employment data simultaneously across sectors, regions, and years, the chart reveals critical insights about regional specialization, sector resilience, and labor market efficiency. Decision-makers can identify which industries show sustainable growth patterns in specific locations, detect emerging employment trends, and benchmark regional sector performance against broader patterns. The multi-layered analysis supports strategic planning for investment targeting, workforce development, and regional economic policy formulation.
The visualization’s integrated approach enables stakeholders to:
- Correlate revenue generation with job creation at sector level
- Compare regional industry performance over business cycles
- Evaluate the effectiveness of sector-specific regional policies
- Identify opportunities for targeted interventions or expansion
This analytical tool provides both macro-level perspective and granular operational insights, making it valuable for economic analysts, corporate strategists, and policy developers working with regional development initiatives.
This report’s comparative analysis of sectoral growth across regions and years directly supports tourism strategy and urban development by identifying high-potential tourism hubs, optimizing infrastructure investments, and balancing visitor demand with local capacity. It reveals which areas are oversaturated or underdeveloped, guiding targeted policies for sustainable tourism expansion while informing urban planners on zoning, transit needs, and mixed-use development priorities aligned with economic trends. The data ensures evidence-based decisions that enhance visitor experiences while maintaining community livability.
Comparative Growth Analysis: Industry Sectors Across Regions (Yearly Data)
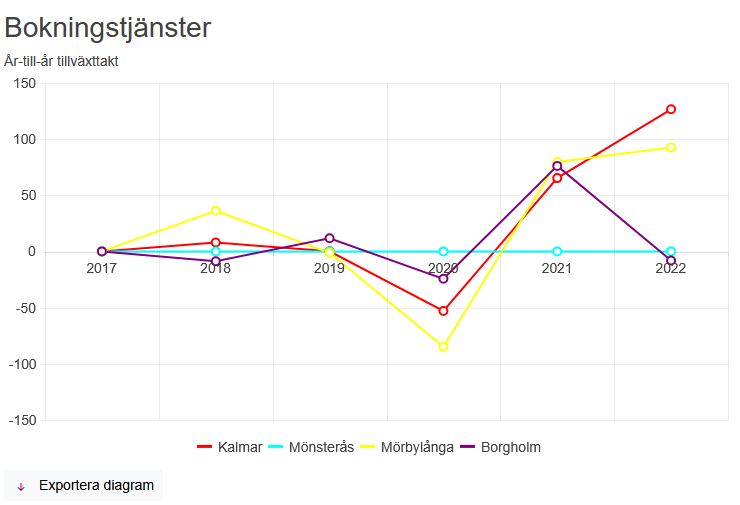
This visualization provides a clear comparative view of annual growth patterns across different industry sectors and geographic regions. By presenting standardized metrics in an aligned timeframe, it enables stakeholders to quickly identify high-performing sectors, recognize emerging regional strengths, and spot underperforming areas requiring attention.
The chart’s value lies in its ability to reveal competitive advantages, track progress of regional development initiatives, and highlight investment opportunities. Economic planners can assess policy effectiveness, while businesses gain insights for market expansion strategies. The year-over-year perspective helps distinguish temporary fluctuations from sustained growth trends, supporting more informed, data-driven decision making at both strategic and operational levels.
This report analyzing revenue per employee across sectors, regions, and years provides critical insights for tourism development and urban planning by quantifying workforce efficiency and economic productivity. It enables destination managers to identify high-performing tourism clusters where labor generates superior value, guiding targeted investments in hospitality training or infrastructure. Urban planners can leverage the data to optimize mixed-use zoning by correlating employee productivity with land-use patterns, ensuring tourism growth aligns with local economic capacity. The comparative regional analysis reveals underperforming areas needing workforce development while highlighting best practices from efficient destinations, supporting evidence-based policies for sustainable tourism economies and balanced urban economic strategies.
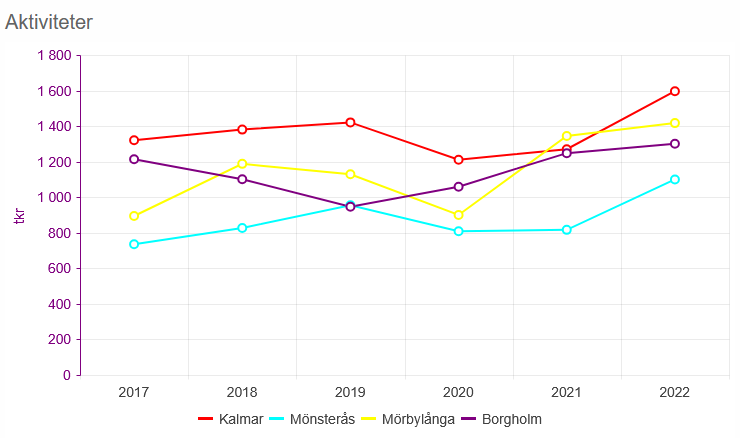
Labor Productivity: Annual Revenue per Employee by Sector & Region
This visualization tracks labor productivity (revenue generated per employee) across sectors and regions. By comparing metrics like:
- Sector efficiency
- Regional disparities (e.g. Kalmar’s outperformance vs. Borgholm)
- Yearly trends (growth/decline post-pandemic),
it identifies where workforce investments yield the highest returns.
Key Insights
- Benchmarking: Reveals top-performing sectors/regions for strategic hiring or expansion.
- Policy Impact: Shows how local initiatives (e.g. training programs) affect productivity over time.
- Cost Efficiency: Highlights where staffing adjustments could optimize revenue.
Example: If “Aktiviteter” (booking services) has declining revenue per employee in Mörbylånga (2020–2022), it may signal overstaffing or falling demand.
Why It Matters
- Businesses: Allocate resources to high-productivity regions/sectors.
- Policymakers: Target workforce development where productivity lags.
- Investors: Spot sustainable growth areas.
Supporting data used for the economic study of the area
The next section will describe the additional information used to support the economic analysis of the area. This includes a detailed breakdown of business sectors based on the SNI code system, with explanations of what each sector covers. It also incorporates population statistics grouped into 5-year age categories to understand the local workforce and demographics. Additionally, the section will outline a list of companies and their workplaces in the area, sorted by their SNI codes, along with yearly records of when businesses were registered and when they closed down.
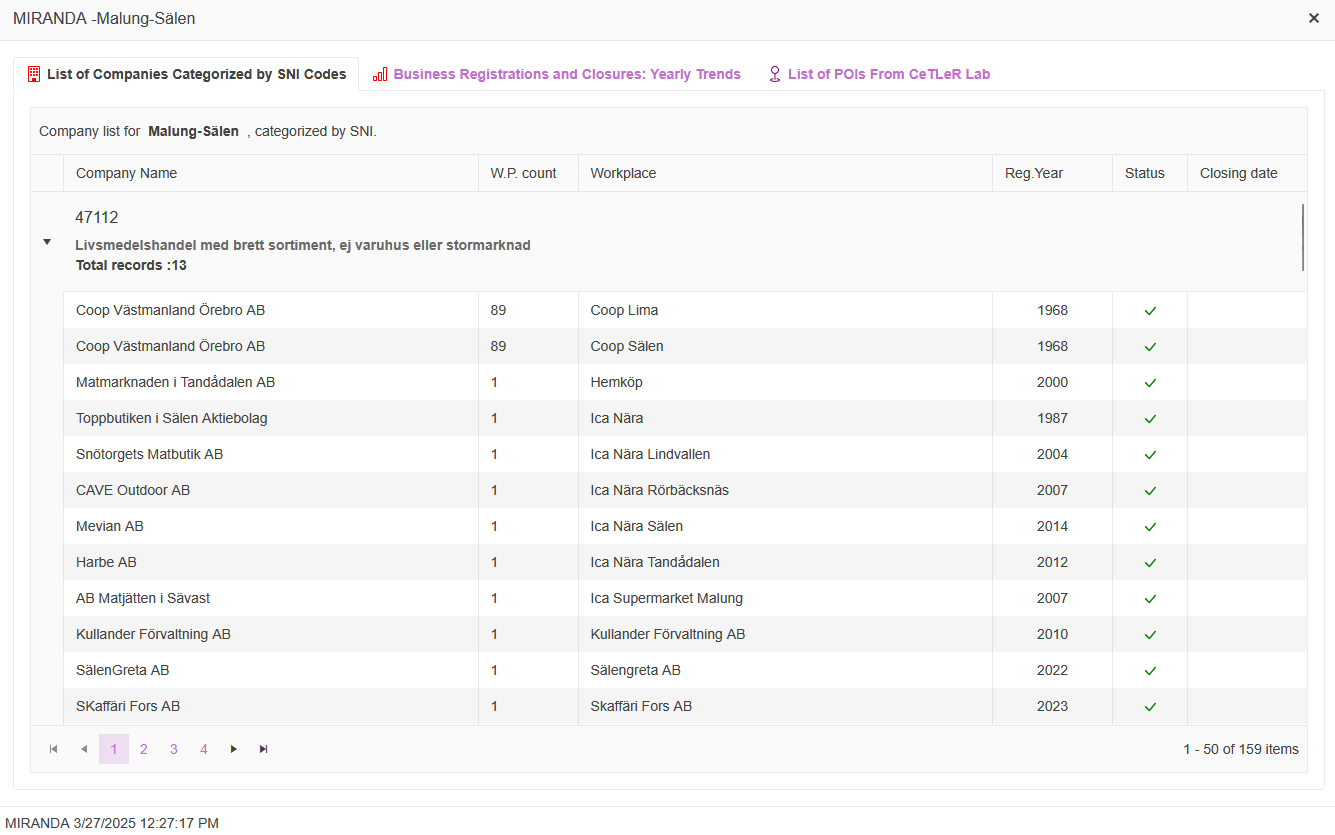
Enterprise Registry: SNI-Coded Companies and Workplaces
This section provides a systematically organized inventory of parent companies and their affiliated workplaces within the study area, classified according to the Standard Industrial Classification (SNI) code system. Each entry specifies the operational status (active or closed) of the company or workplace and includes its year of registration. This dataset enables a granular analysis of business distribution, longevity, and sector-specific activity, while offering a temporal dimension to track enterprise establishment and discontinuation patterns.
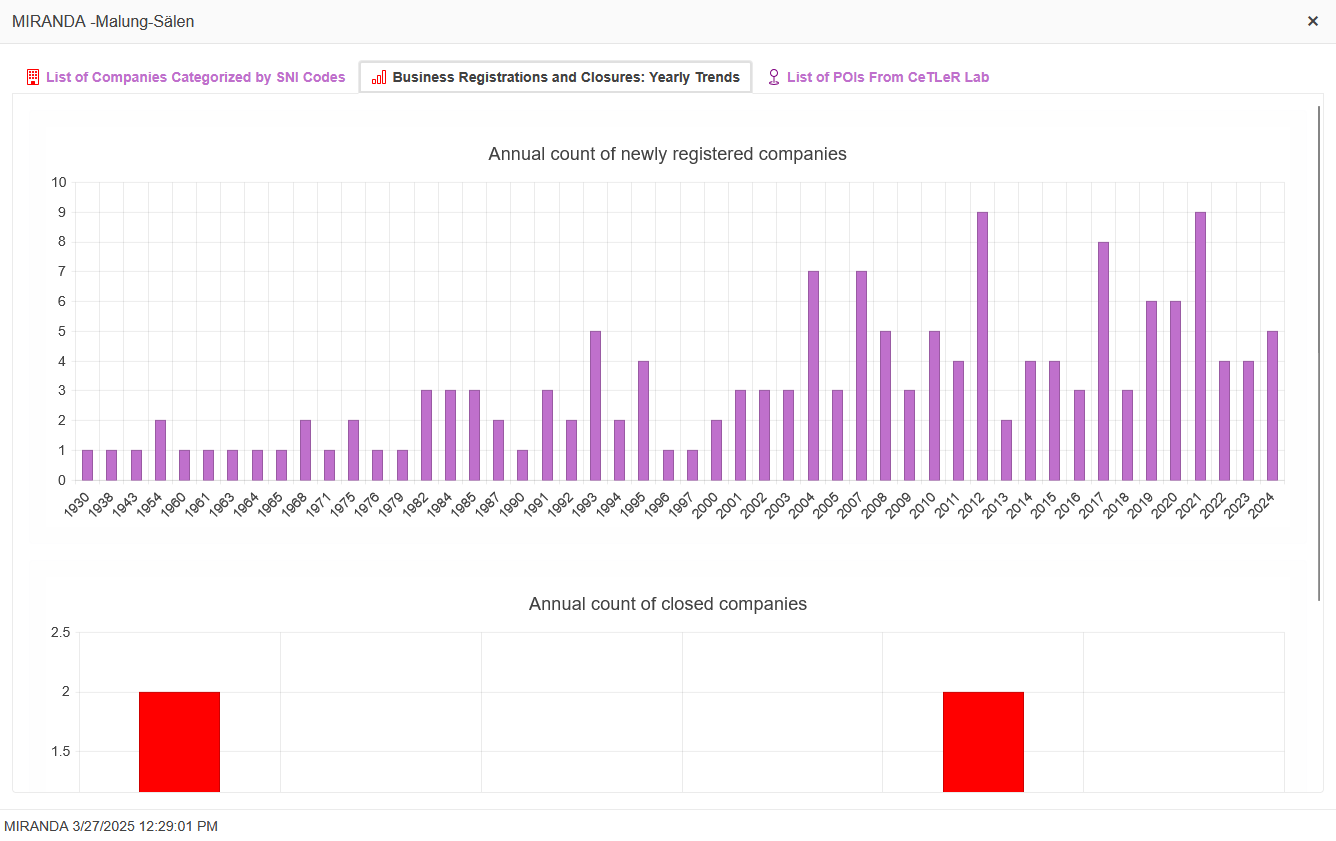
Business Registration and Discontinuation Trends
- Analyses historical data on when companies were formally registered in the area.
- Examines patterns and timelines of company closures over the years.
Analyses company registration and closure timelines in a tourism-focused area reveals how the sector evolves. New registrations (e.g. hotels, tour operators) signal growth phases, investment trends, or responses to infrastructure/policy changes. Closures expose risks like seasonal instability, market oversupply, or crises (e.g. pandemics). Long-standing businesses indicate resilience, while frequent closures highlight vulnerabilities. This data links economic shifts to local employment, guides targeted investments, and helps policymakers foster sustainable tourism by addressing gaps or capitalizing on emerging opportunities.
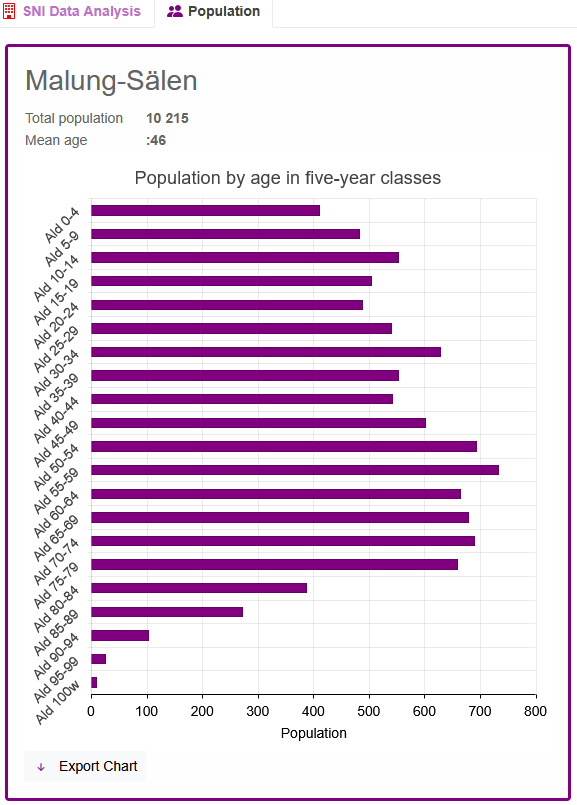
Age-Stratified Population Demographics
Age-stratified population data (grouped by 5-year intervals) helps analyse the economic potential and needs of an area by showing how many people are in key life stages. A large working-age population signals labor availability and productivity, while a high youth population highlights future workforce or education demands. Older age groups indicate healthcare or pension priorities. It also reveals spending patterns (e.g. families vs. retirees) and flags challenges like aging workforces or youth unemployment. Overall, it clarifies who drives the economy now and what investments or policies will matter most in the future.
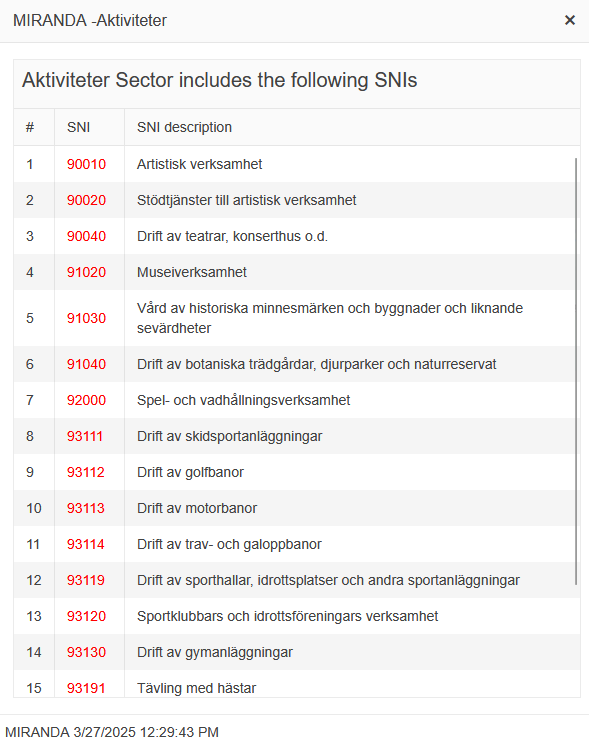
SNI Codes by Economic Sector
This classification ensures systematic, sector-focused analysis, clarifying industry dynamics and enabling targeted decision-making for economic development.
Last Updated: